🌚 Dark
🌝 Light
← Home
Posts
Recent Posts
2023
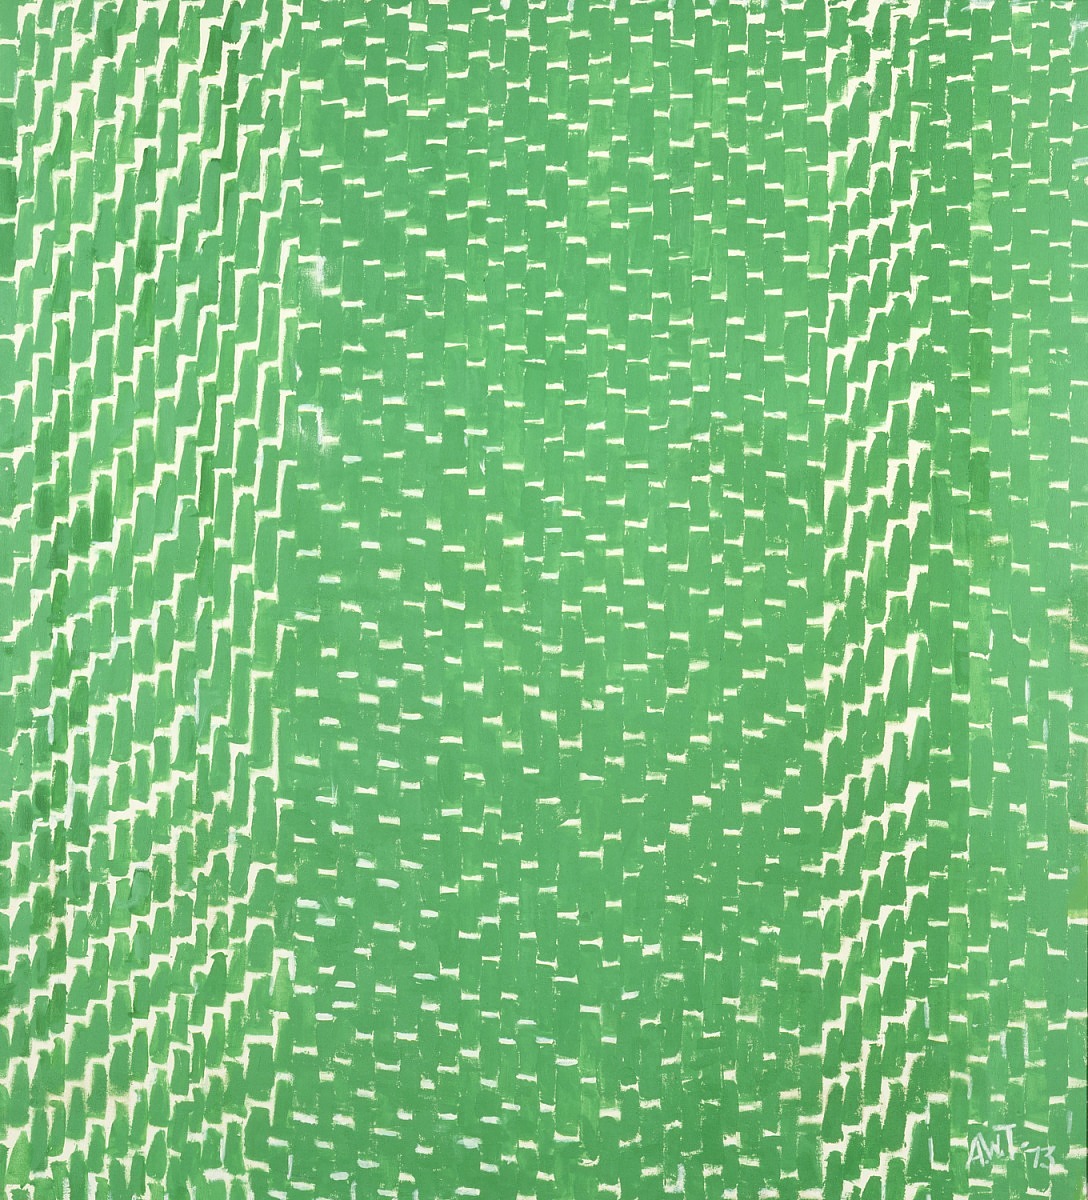
A Washington, DC Takeoff
Reflections from a walk, a NASA visit, an art exhibit, and a move.
life
Alma Thomas
NASA
2026
An Opinionated Guide to Urban Cycling
Many people feel scared or uncertain around riding and maintaining their bicycles. I wrote a zine about it.
Zines
Milwaukee Zine Fest
Biking
Art
Cartoons
2026
Play Crabapple Games Today
A daily puzzle game platform for dabblers
Anagrams
Crabapple Games
Dabblegrams
Dabbler
Cartoons
Puzzle Games
Featured Posts
2026
Play Crabapple Games Today
A daily puzzle game platform for dabblers
Anagrams
Crabapple Games
Dabblegrams
Dabbler
Cartoons
Puzzle Games
2026
An Opinionated Guide to Urban Cycling
Many people feel scared or uncertain around riding and maintaining their bicycles. I wrote a zine about it.
Zines
Milwaukee Zine Fest
Biking
Art
Cartoons
2023
A Washington, DC Takeoff
Reflections from a walk, a NASA visit, an art exhibit, and a move.
life
Alma Thomas
NASA
2020
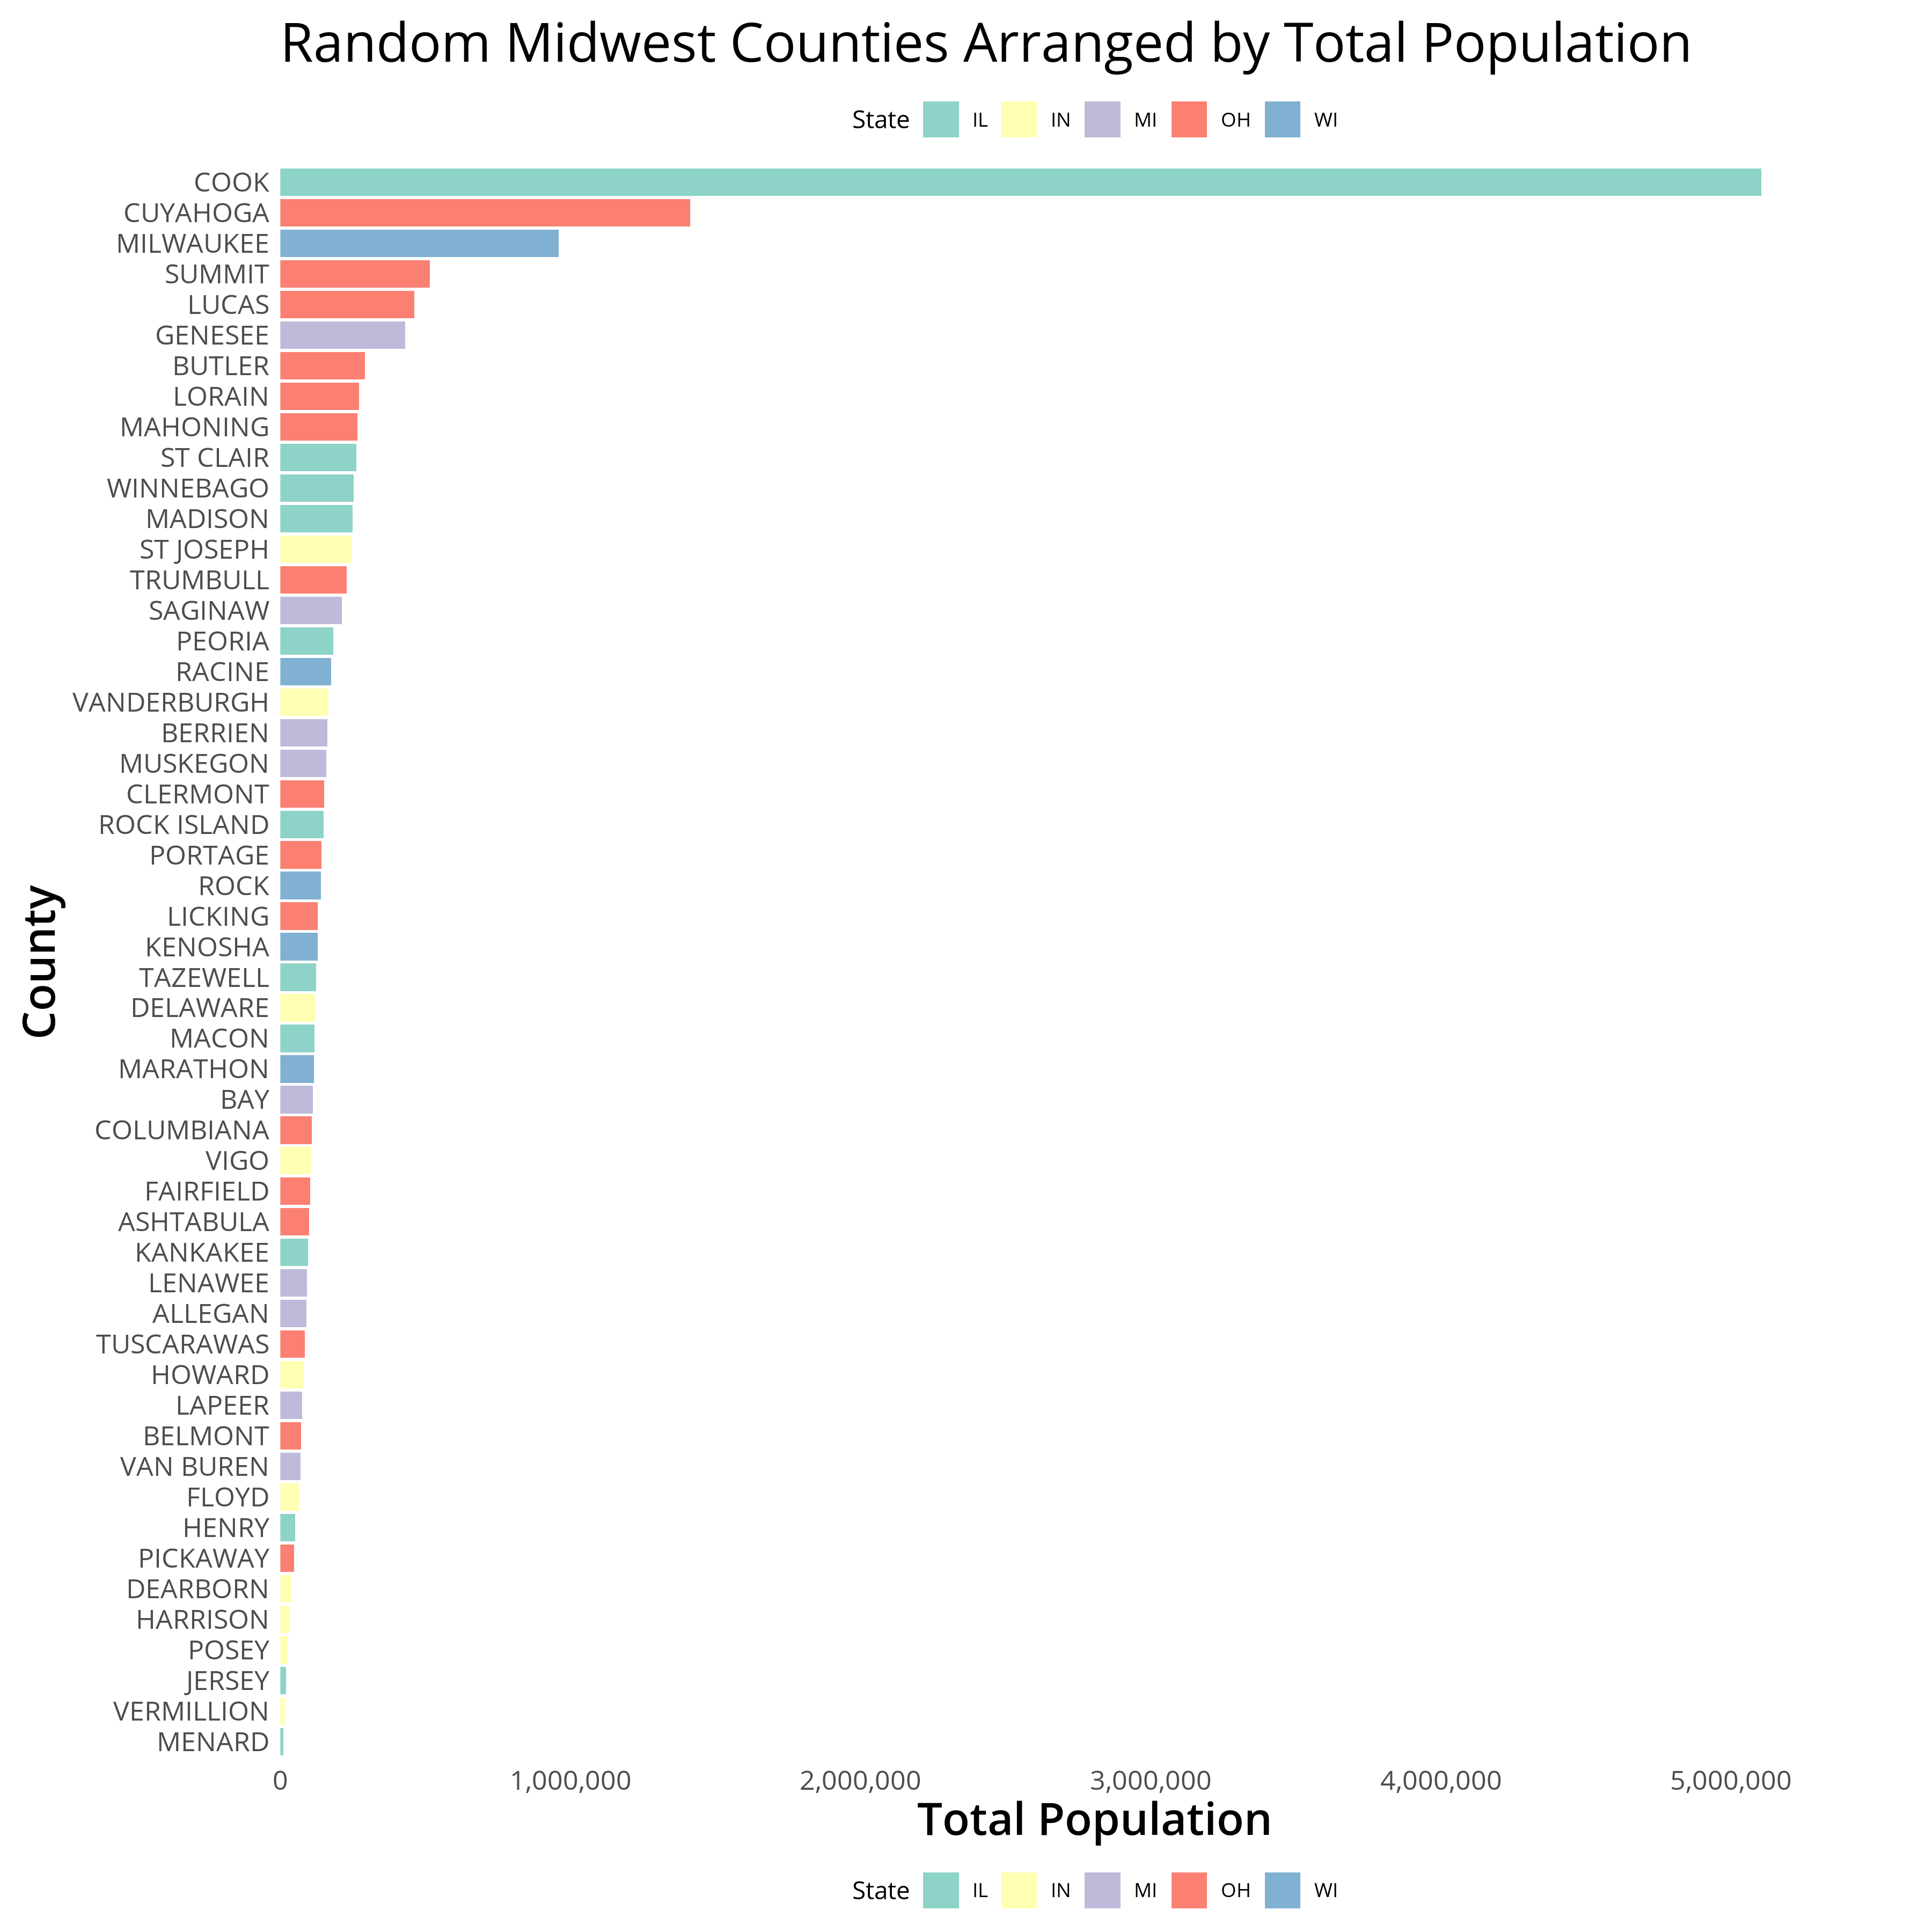
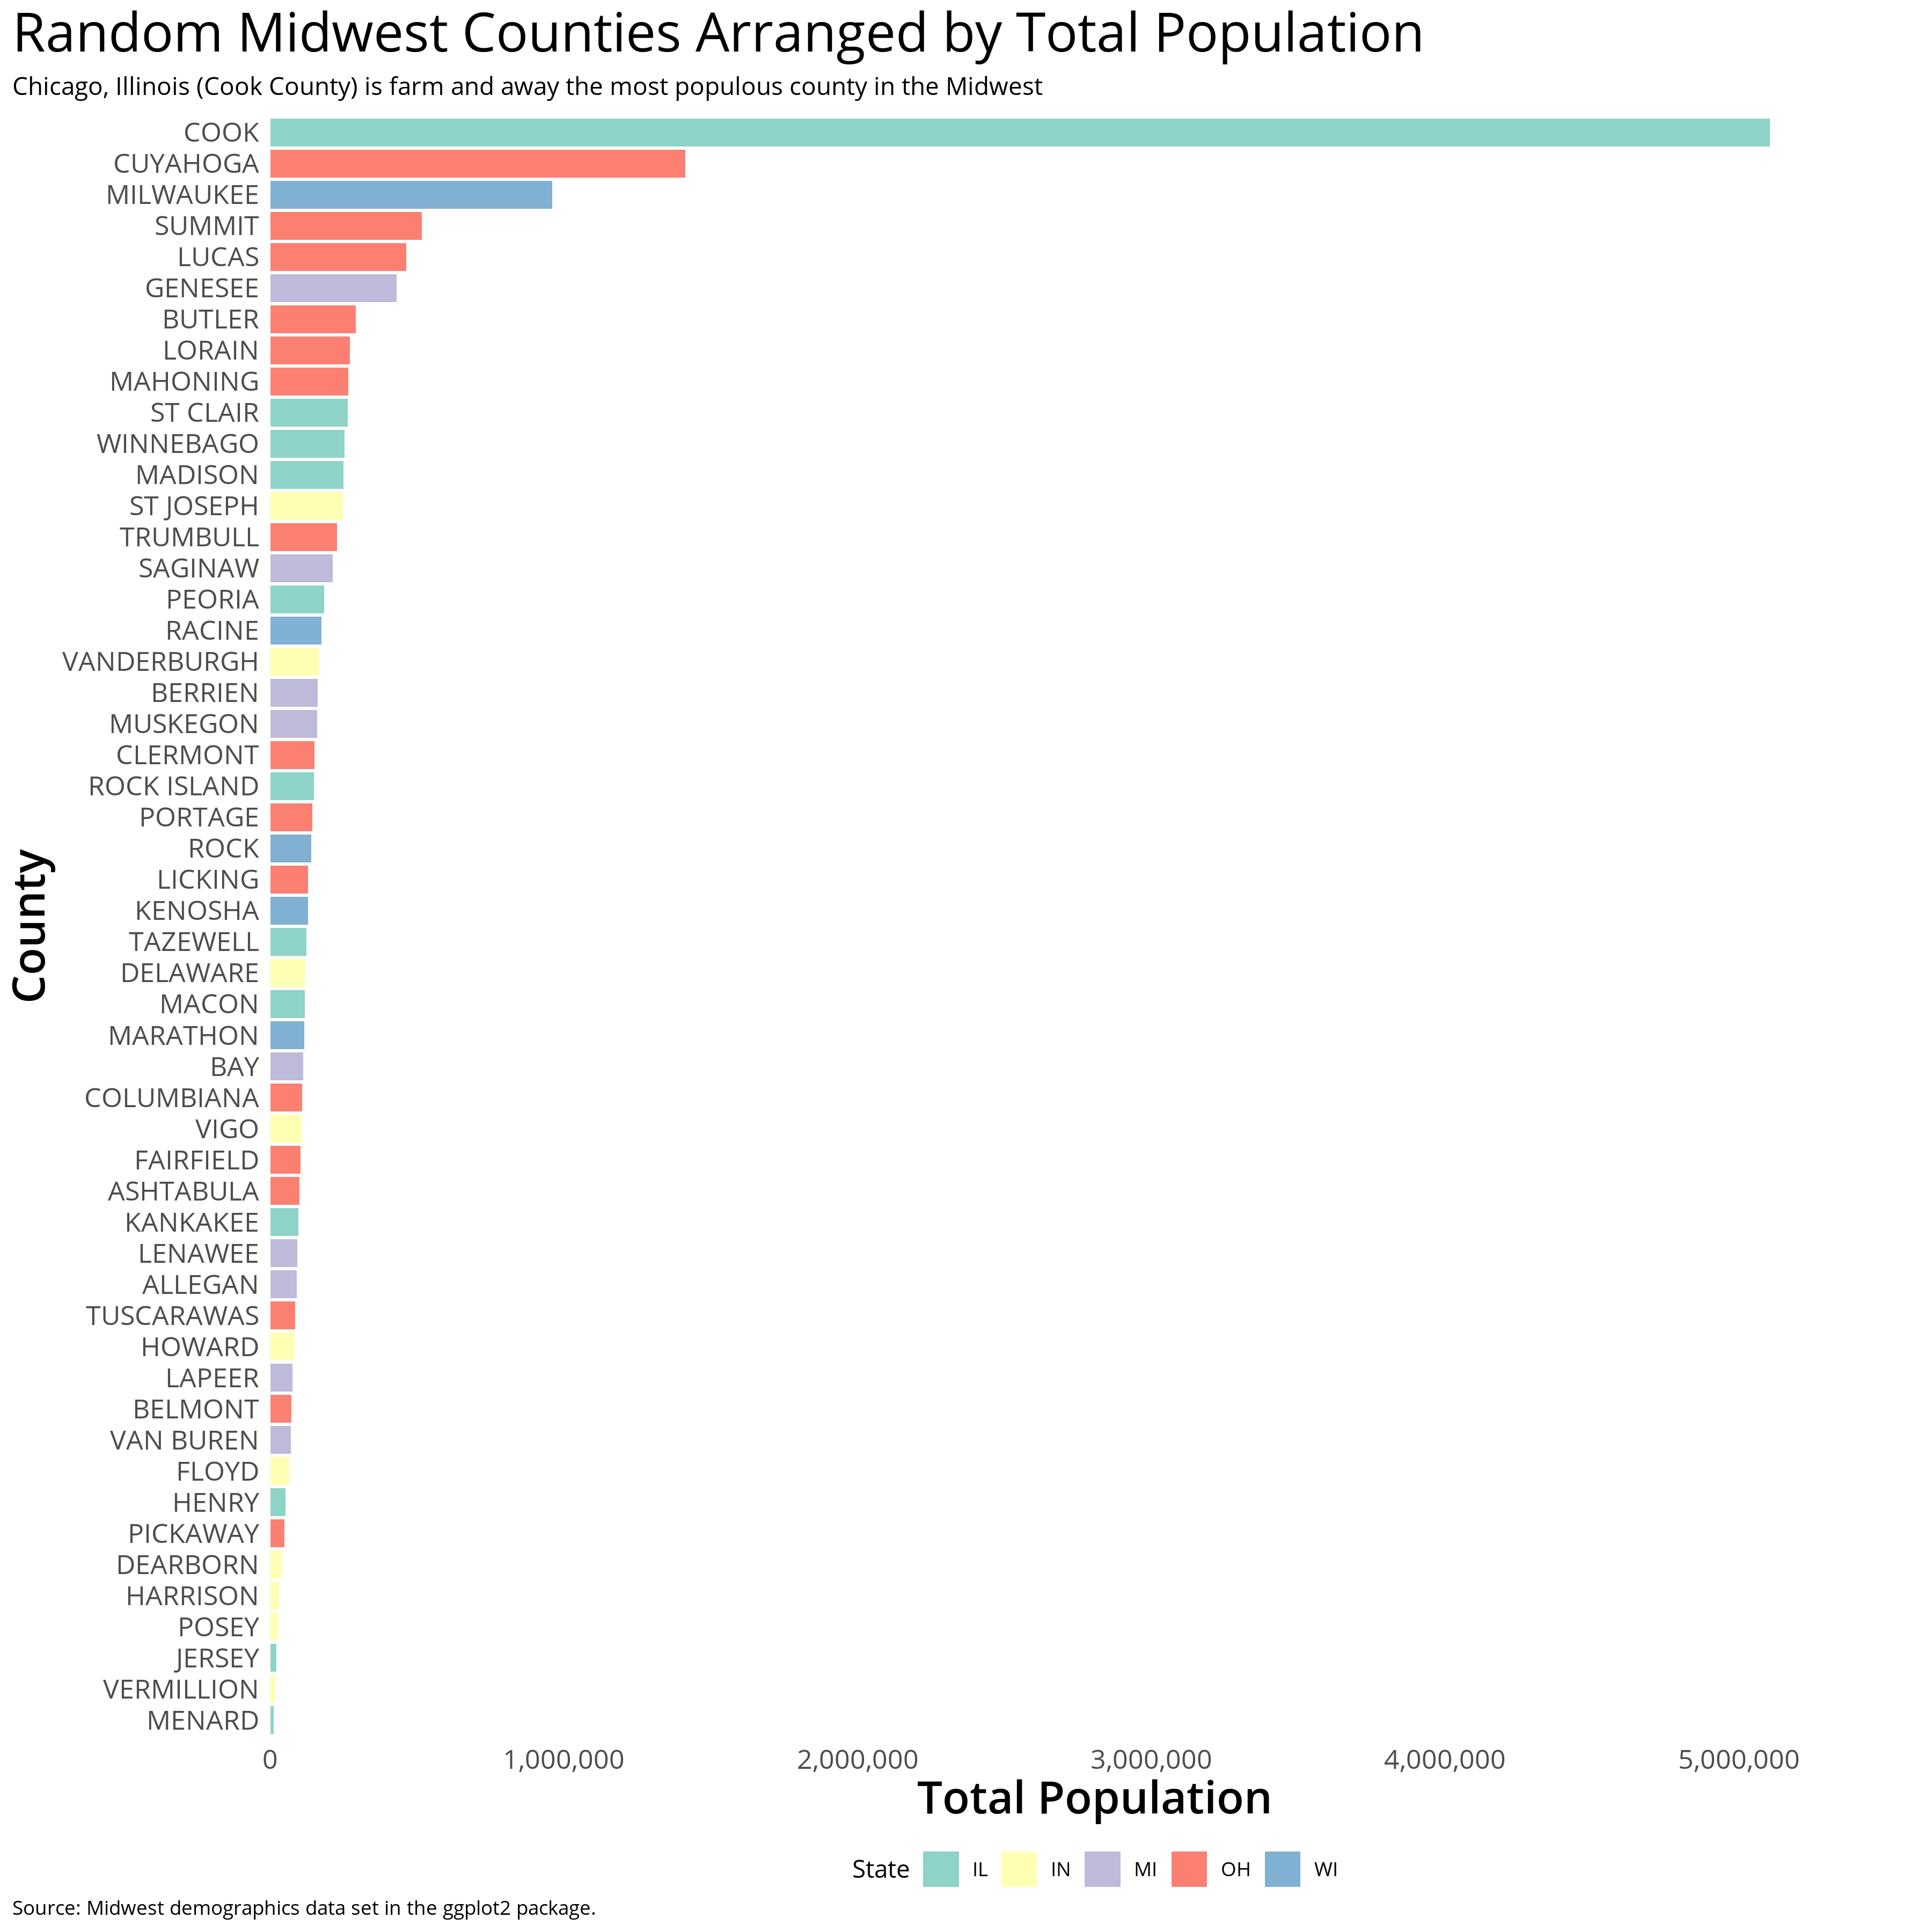
Quick ggplot2 Tip: Creating Duplicate Legends
Duplicate a plot legend's to add a second key where the audience can better understand your figure
dataviz
ggplot2
animation
R
2020
Quick ggplot2 Tip: Left Align ggplot2 Titles, Subtitles, and Footnotes with Y-Axis Label
Override ggplot2 defaults to add a consistent left-alignment throughout your figure
dataviz
ggplot2
R
2019
R Animation Tip: Creating Pauses
Improve your R animations by implementing pause frames for emphasis
dataviz
ggplot2
animation
R
2019
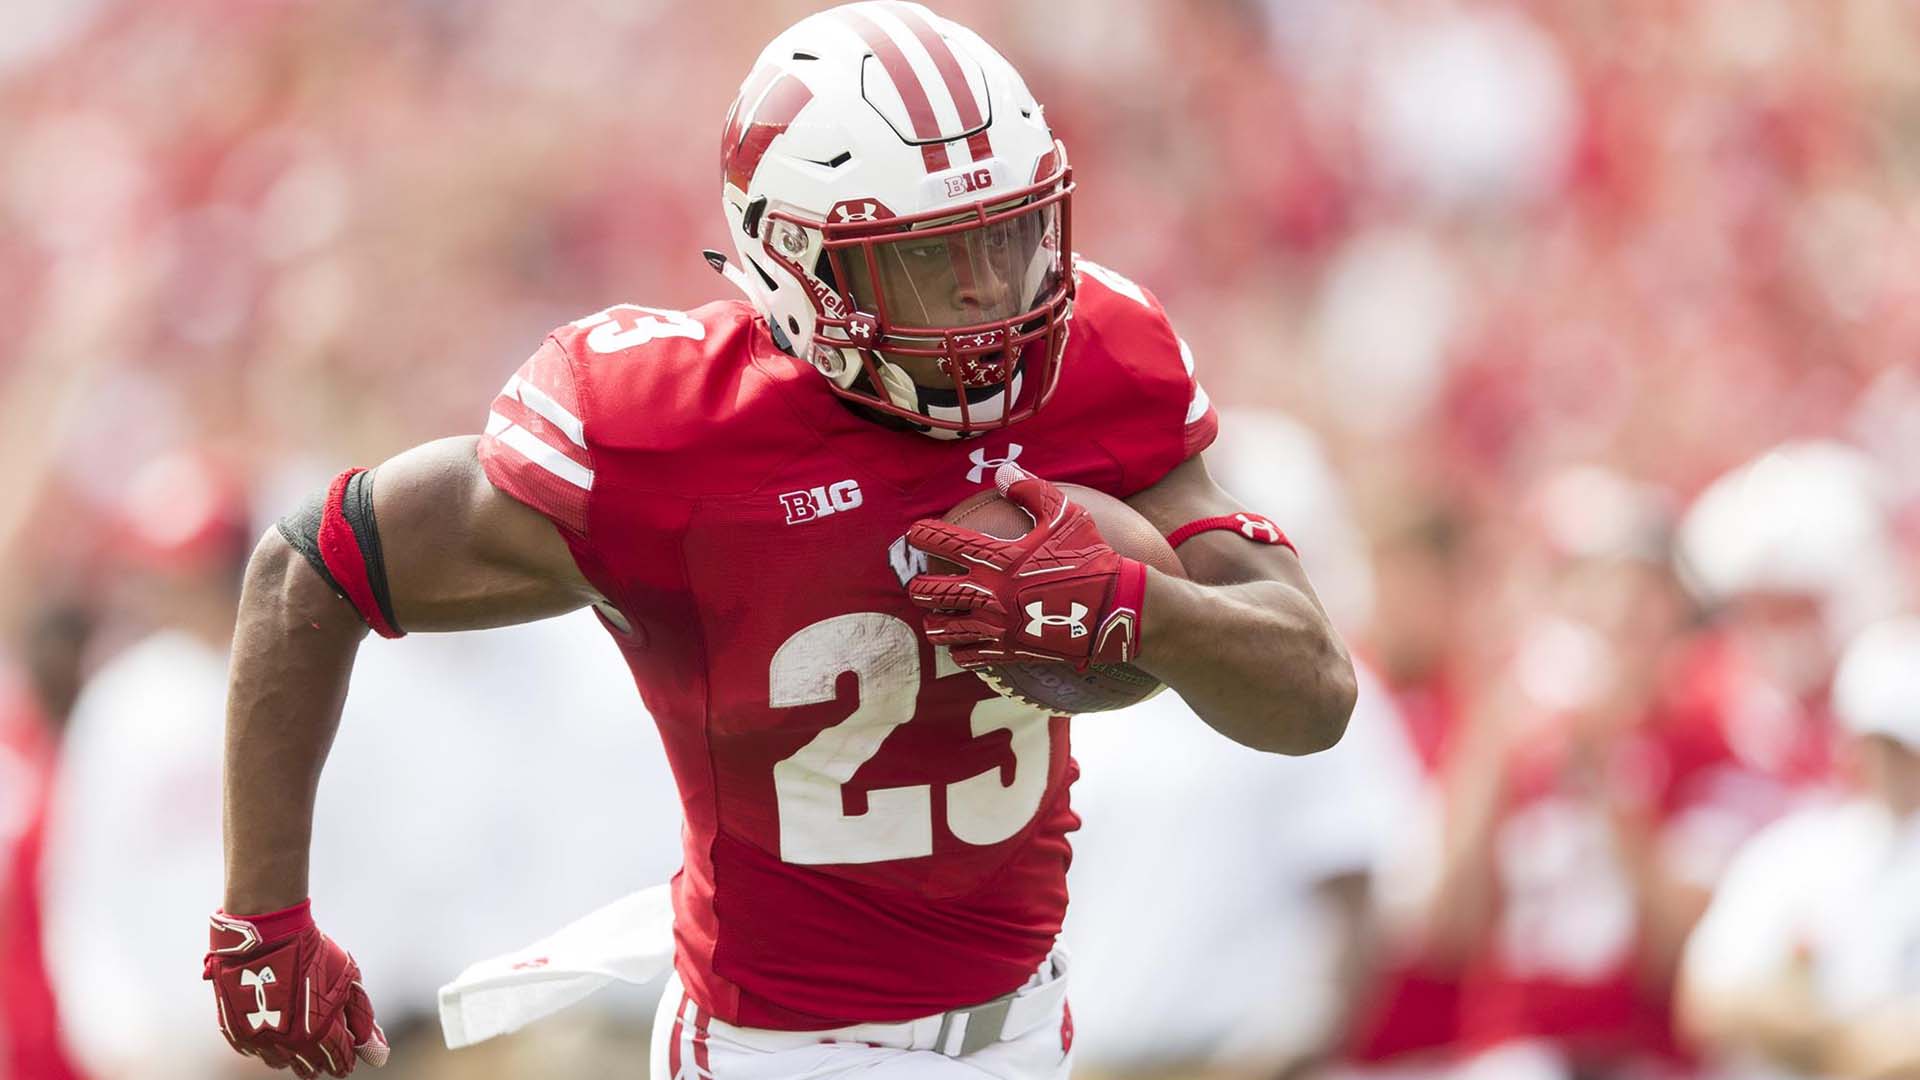
The Dominance of Jonathan Taylor: Wisconsin Rushers in Context
Why Jonathan Taylor is on pace to be the greatest rusher in Wisconsin football history
dataviz
dplyr
ggplot2
sports
R
2017
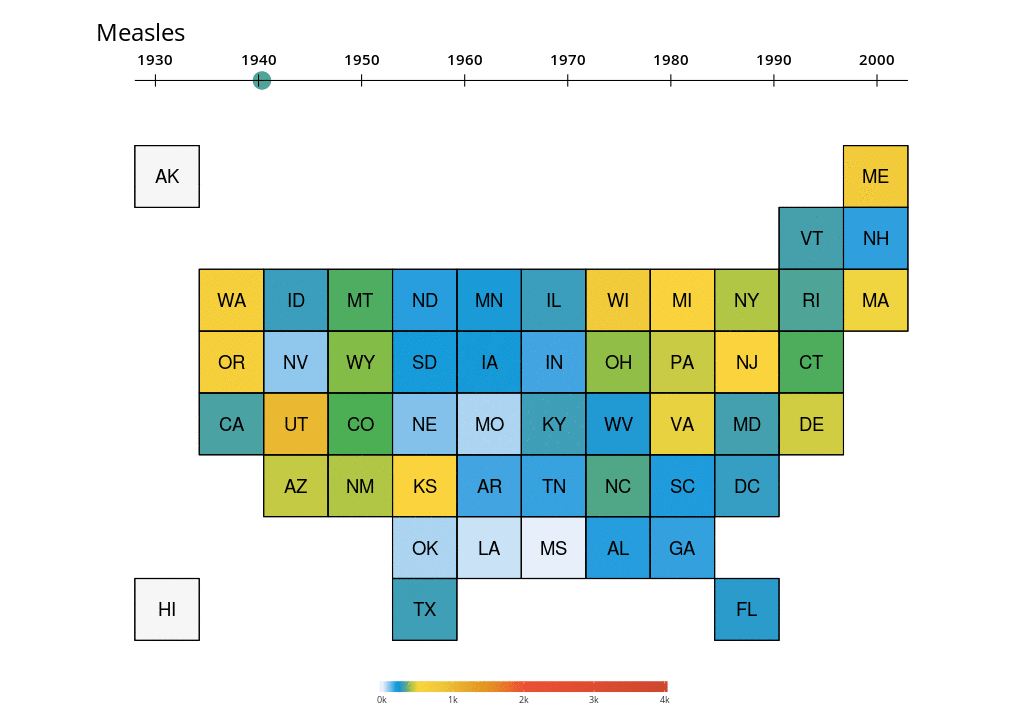
Makeover Monday: WSJ Measles Vaccination Chart
Using ggplot2 and animation packages to reproduce and animate the famous Wall Street Journal Measles Incidence Chart - this time as a cartogram!
animation
dataviz
ggplot2
makeover monday
R
2017
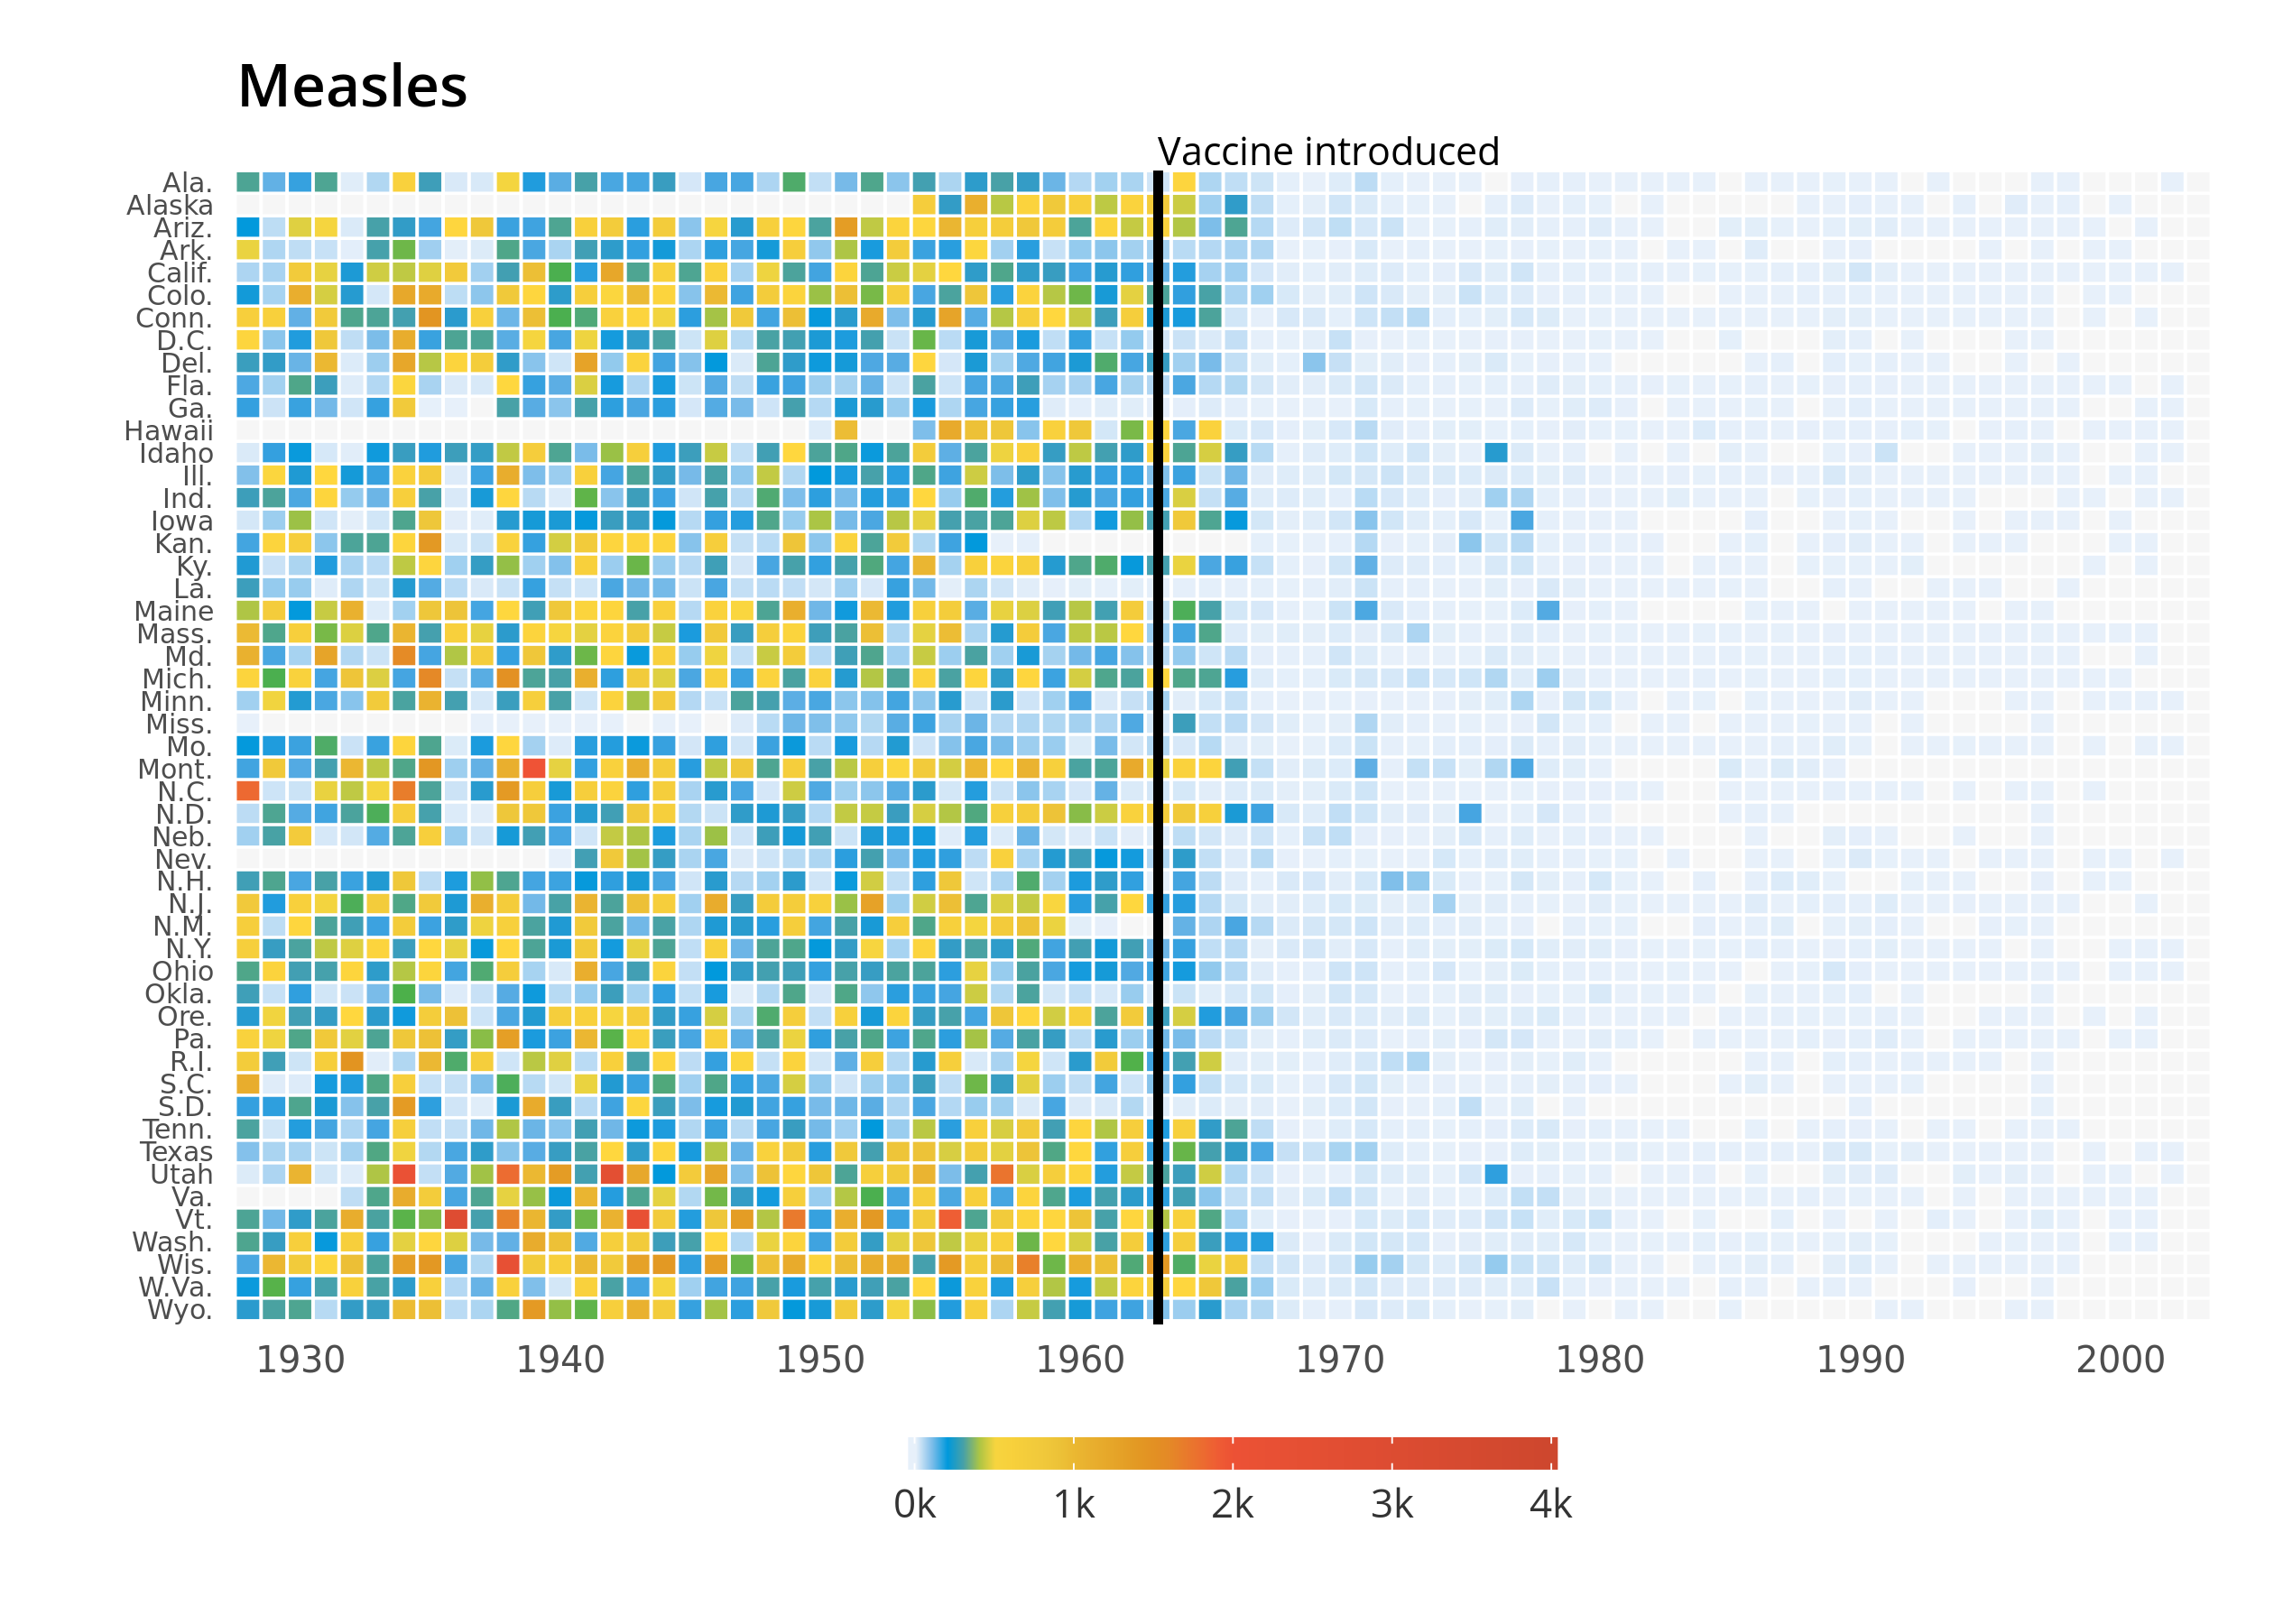
Reproducing the WSJ Measles Vaccination Chart Using R
Using ggplot2 and animation packages to reproduce and animate the famous Wall Street Journal Measles Incidence Chart
animation
dataviz
ggplot2
gganimate
R
2017
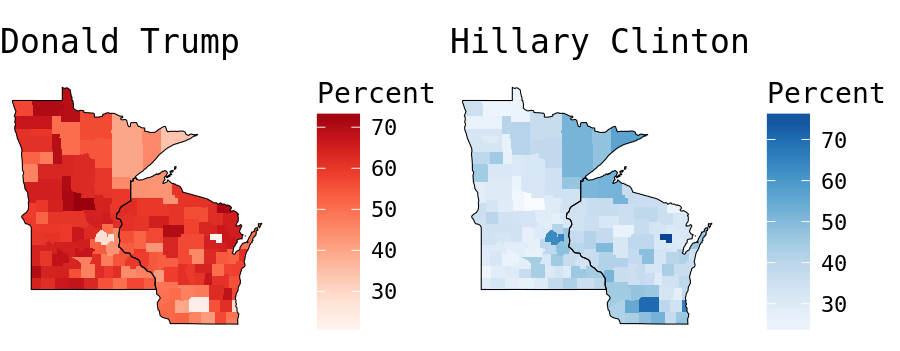
Mapping Wisconsin Presidential Election Results
Wisconsin played a major role in the presidential election, but the result is not due to major differences with its Midwest neighbor.
R
ggplot2
politics
dataviz
2015
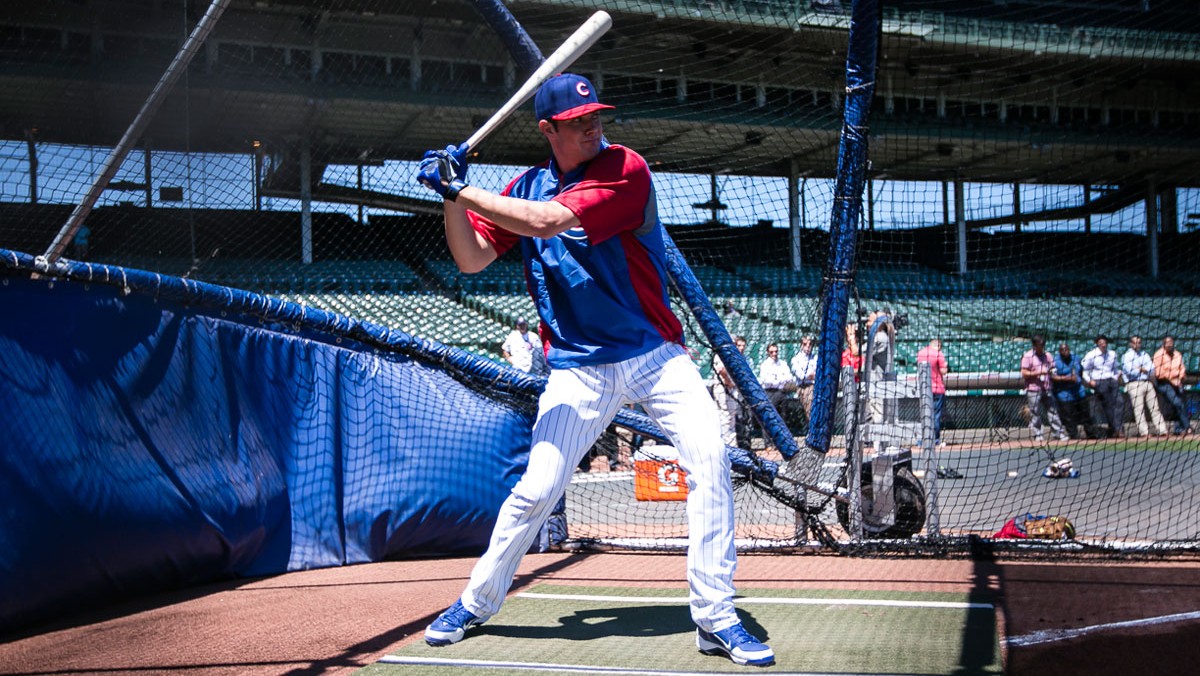
Let's Make a Minor League Baseball Database!
A step-by-step tutorial to make your own Minor League Baseball Database using rvest.
R
rvest
HTML scraper
data
sports
MiLB
MLB