R Animation Tip: Creating Pauses
Improve your R animations by implementing pause frames for emphasis
Mastering Animation in R
Over the last couple years I’ve developed a multitude of animations using R. During this process I’ve learned quite a bit about R graphics, gpplot2, and useful techniques in animation. In fact I presented on methods for animation in R at satRdays DC - slides available here
One simple technique to improving animations is the addition of pauses. Pauses are an effective method of capturing the viewer’s attention and driving home the main message of an animation. Pausing at the end of an animation (before it loops) offers the viewer the full scope of the visualization, and pauses during the animation can be used to emphasize key data points.
Let’s walk through creating a pause in R.
Creating Pauses in R - Libraries and Data Reshaping
We’ll use the txhousing data set in the ggplot2 package to
demonstrate - this data set contains information regarding the housing
market in Texas provided by the TAMU real estate
center. The animation will plot the median
sale price of two cities - Abilene and Amarillo - from 2000 to 2015.
In my satuRdays DC presentation I covered the steps taken to develop an R animation:
Interpolate your data
Structure your data to create frames that move across the dimension of interest
Determine plot aspects that require consistency across the animation (annotations, scales, legends, etc)
Append and export the frames
The variable year contains the unique data values across our animation
splitwill generate a list of data frames we can apply interpolations to using thetweenrpackage.
R Libraries and Data Reshaping
    library(ggplot2)
    library(scales)
    library(extrafont)
    library(dplyr)
    library(tweenr)
    library(lubridate)
    library(animation)
    library(RColorBrewer)
    library(grid)
    loadfonts()


    # create data frame from txhousing data included in ggplot2 package
    txHousingData <- txhousing %>% filter(city %in% unique(txhousing$city)[1:2] & month==1)
    txHousingData <- txHousingData[,c(1,2,6)]
    txHousingData$city <- factor(txHousingData$city, levels = c("Abilene","Amarillo"), labels = c("Abilene","Amarillo"))

    # determine the unique data values that tweenr will iterate over (in this case year)
    txList <- split(txHousingData,txHousingData$year)

    # Apply tweenr to interpolate frames between data points
    txTweenedData <- tween_states(txList, tweenlength= 1, statelength=0, ease='linear',nframes=200)
Since our data is arranged by year by default, it’s already structured
in a fashion that moves across our dimension of interest (change over
time) - so we’ve already completed the first two animation steps. Now
that we’ve got our interpolated data frame txTweenedData we can focus
on the plot aesthetics.
Plot Aesthetics
ggplot2 Theme and Color Palette
    # plot aesthetics
    theme_white <- theme(text = element_text(family="Open Sans"),
                         panel.grid.major.y=element_blank(),
                         panel.grid.major.x=element_blank(),
                         panel.grid.minor.x=element_blank(),
                         panel.grid.minor.y=element_blank(),
                         axis.title.x=element_text(size=20, margin = margin(t=10)),
                         axis.title.y=element_text(size=20, margin = margin(t=10)),
                         axis.text.x=element_text(size=16),
                         axis.text.y=element_text(size=16),
                         axis.ticks = element_blank(),
                         plot.title=element_text(size=26,family = "Open Sans",lineheight=1.15),
                         plot.subtitle=element_text(size=20, margin = margin(t=20, b = -5),hjust = -0.03, family = "Open Sans"),
                         plot.caption=element_text(size=14, margin=margin(t=15,r=-15),hjust = -.03,lineheight=1.15, family = "Open Sans", face  = "italic"),
                         legend.position="none"
    )

    # color palette
    my_palette = c("#3EC7F4", "#3FA66C")
It’s critical to determine plot aspects that require consistency across the animation. I like to assign this information as variable objects so that it can easily update across different frames contained in the plotting code. If these aren’t explicitly noted, ggplot2 will render the defaults in their place.
Plot Axes, Labels, and Titles
    # y axis breaks and labels
    yAxisBreaks <- seq(0, 140000, by = 20000)
    yAxisLabels <- paste0(format(yAxisBreaks))
    yAxisLimits <- c(0,max(yAxisBreaks)* 1.03)
    yAxisLabels <- c(yAxisLabels[1:length(yAxisLabels)-1], paste0("$",yAxisLabels[length(yAxisLabels)]))

    # x axis breaks and labels
    xAxis <- seq(2000, 2015, by = 2)
    xAxisBreaks <- xAxis
    xAxisLimits <- c(1999.5, 2019)

    # plot text
    title <- "Median sale price of homes in Abilene and Amarillo, 2000 through 2015"
    subtitle <- ""
    caption <- "Information about the housing market in Texas provided by the TAMU real estate center, http://recenter.tamu.edu/."
    xLab <- "Year"
    yLab <- "Median sale price"

    midPoint <- round(max(txTweenedData$.frame) / 2)

    # add adjustments for line labels
    txTweenedData$LevelLabel <- as.character(txTweenedData$city)
    txTweenedData$nudge_x <- ifelse(txTweenedData$LevelLabel=="Abilene", 1.096,ifelse(txTweenedData$LevelLabel=="Amarillo",1.233,0))
    txTweenedData$nudge_y <- 0
Creating Pauses
Finally we’ve reached our R animation tip - and thankfully it’s pretty
trivial! To generate pauses within an animation simply determine where
the pause exists, subset your data to include that frame, and use replicate and grid.draw to repeat that frame n-times. For instance,
say I wanted to pause at the midpoint of the animation to emphasize a
point. I’d first calculate the midpoint, then ensure that my data
includes all frames until that point: subset(txTweenedData, .frame <= midPoint).
Animation Code
    #calculate midpoint of the plot
    midPoint <- round(max(txTweenedData$.frame) / 2)

    g2 <- ggplot(data = subset(txTweenedData, .frame <= midPoint), aes(x = year, y = median, .frame = midPoint)) +
        geom_point(data = subset(txTweenedData, .frame == min(.frame)),aes(group=city, color=city), size=5) +
        geom_point(data = subset(txTweenedData, .frame == midPoint),aes(group=city, color=city), size=5) +
        geom_line(aes(group=city, color=city, cumulative = TRUE, label=LevelLabel), size=2.5) +
        scale_x_continuous(labels=xAxisBreaks, expand = c(0, 0), breaks=xAxisBreaks, limits =xAxisLimits) +
        scale_y_continuous(labels=yAxisLabels, expand = c(0, 0), breaks=yAxisBreaks,limits = yAxisLimits)
    g2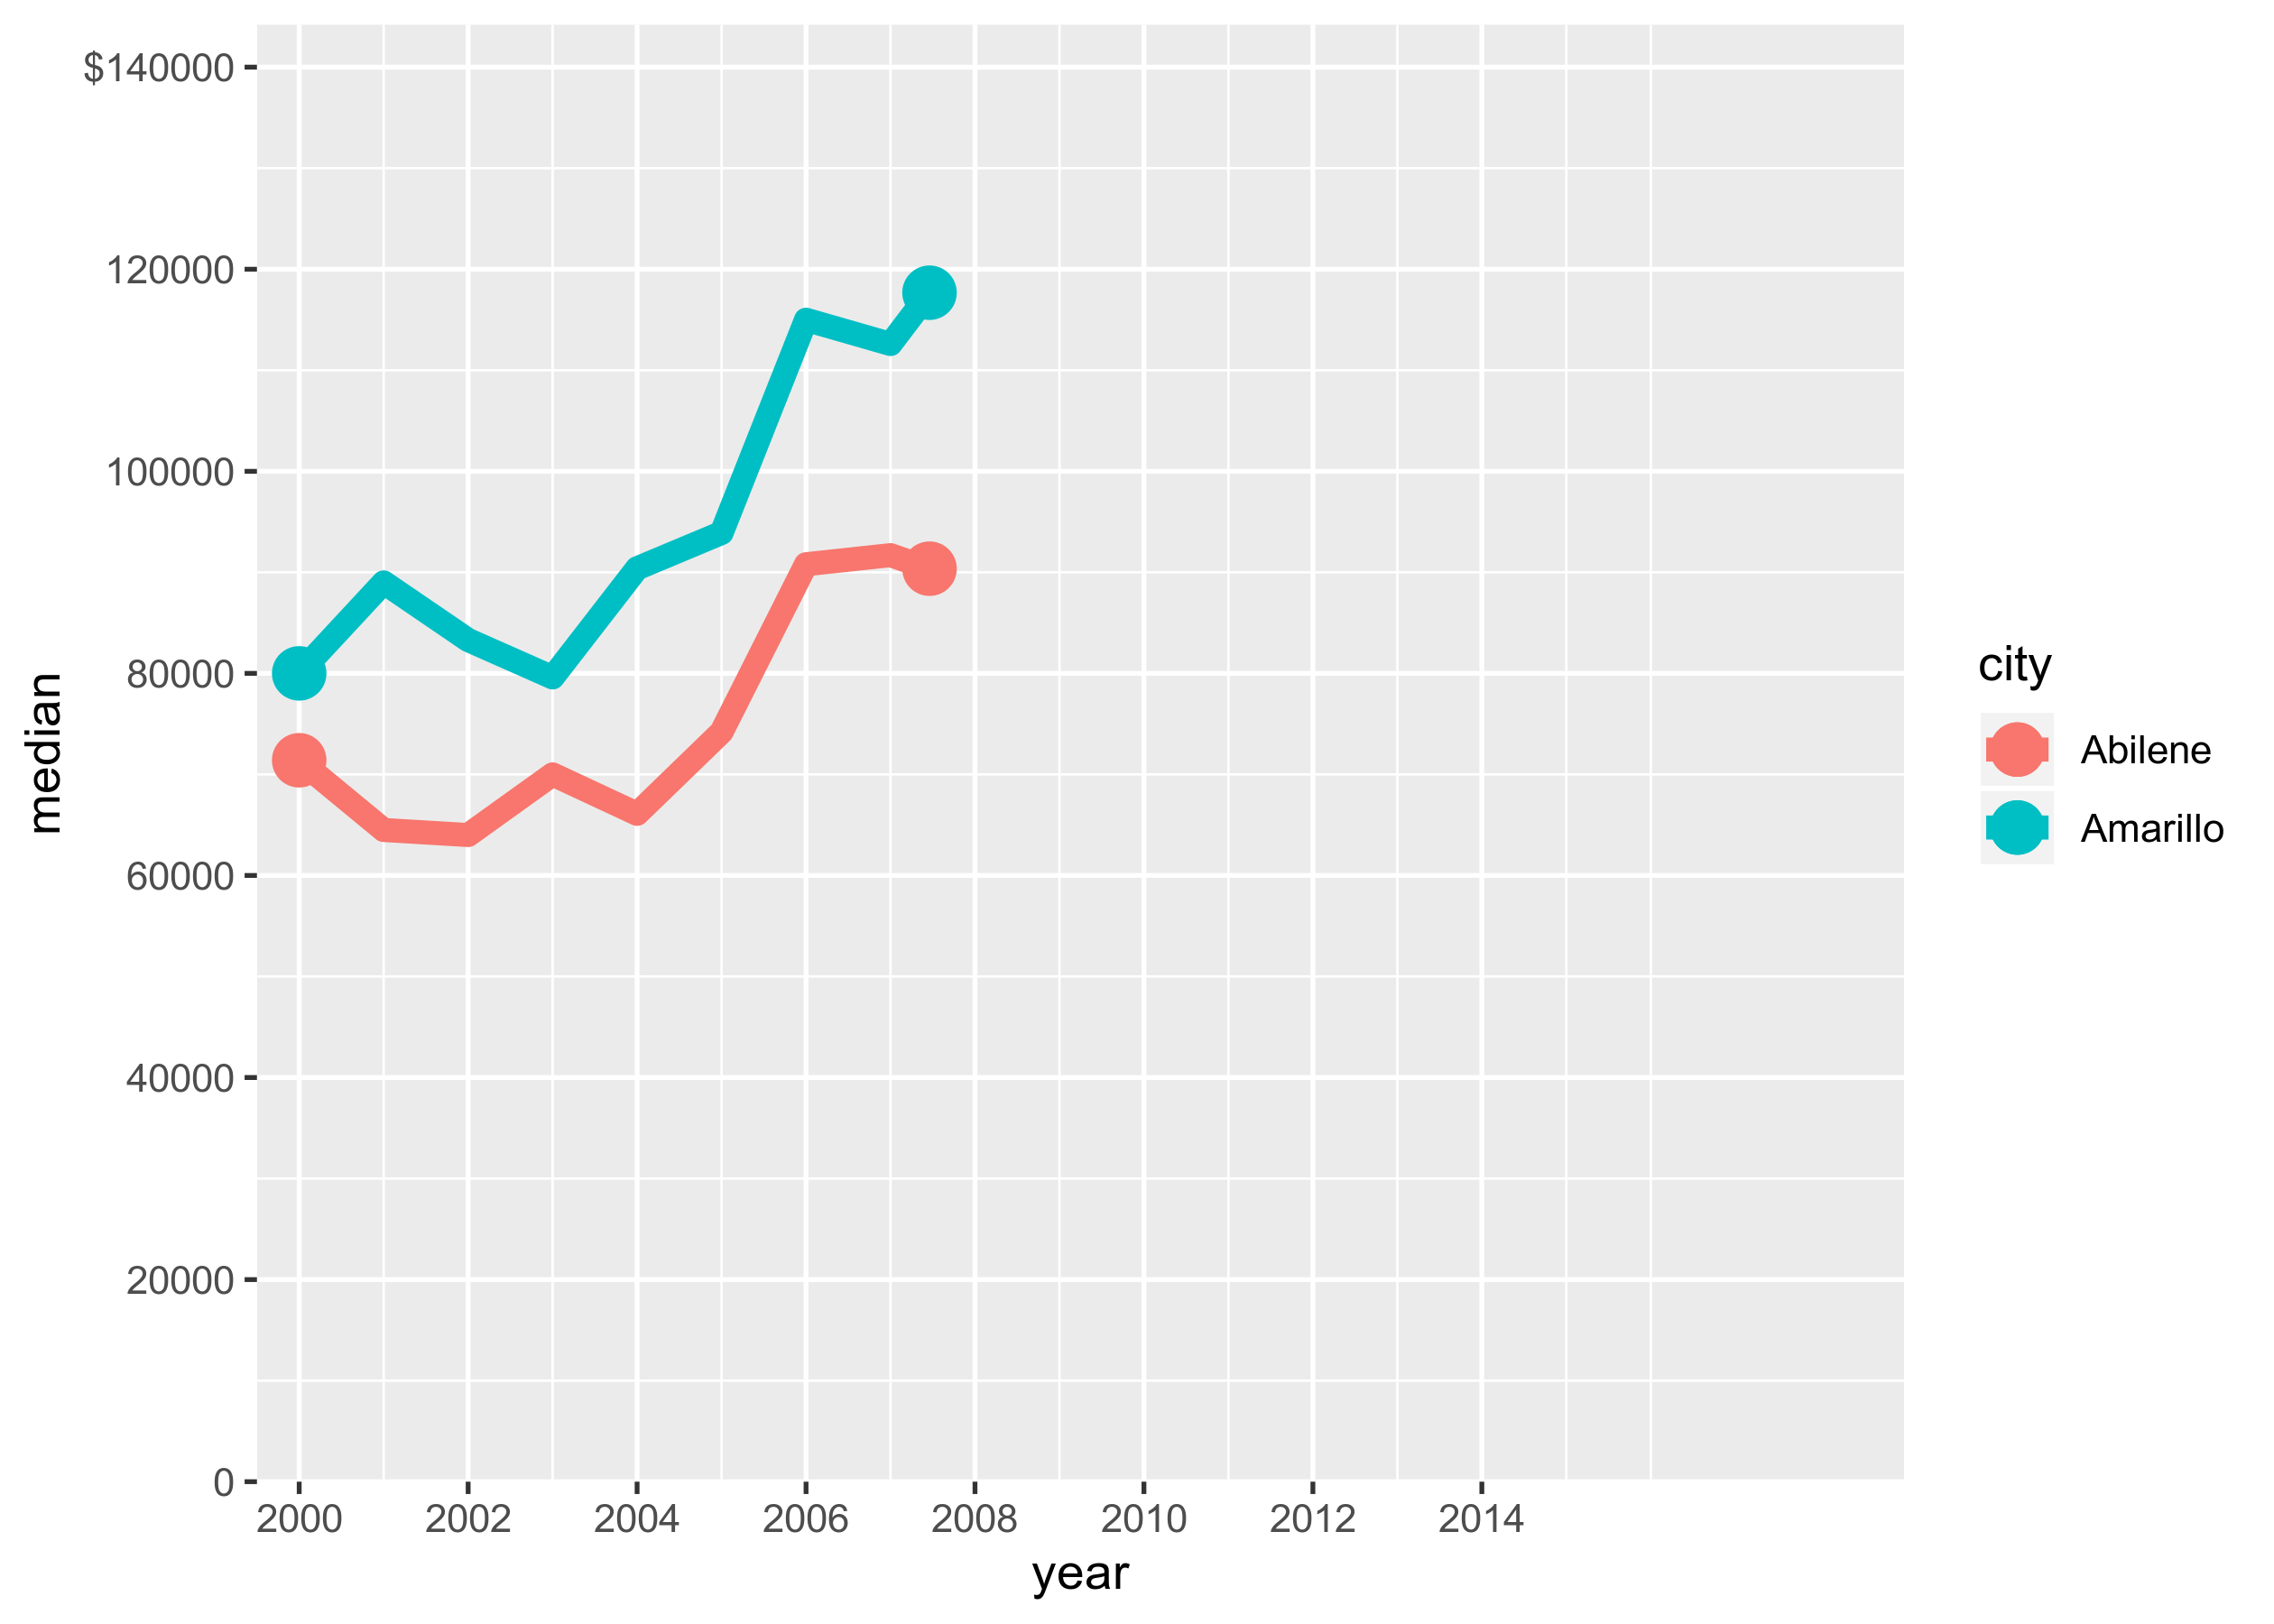
Once we’ve created this frame, replicate and grid.draw repeat that
frame n-times to create a pause.
replicate(75,grid.draw(g2))Simple as that!
Full Animation Code within saveGIF
(NOTE: click on the gray bars to toggle collapsing the code!)
Animation Code
    saveGIF({

      # print from tue first frame to the midpoint of the figure
      for(i in 1:midPoint) {
        g1 <-  ggplot(data = subset(txTweenedData, .frame <= i), aes(x = year, y = median, .frame = i)) +
          geom_point(data = subset(txTweenedData, .frame == min(.frame)),aes(group=city, color=city), size=5) +
          geom_line(aes(group=city, color=city, cumulative = TRUE, label=LevelLabel), size=2.5) +
          scale_x_continuous(labels=xAxisBreaks, expand = c(0, 0), breaks=xAxisBreaks, limits =xAxisLimits) +
          scale_y_continuous(labels=yAxisLabels, expand = c(0, 0), breaks=yAxisBreaks,limits = yAxisLimits) +
          theme_minimal() + theme_white + scale_color_manual(values=my_palette) +
          geom_text(data = subset(txTweenedData, .frame == i),aes(label =LevelLabel), size = 9, nudge_y = subset(txTweenedData, .frame == i)$nudge_y, nudge_x = subset(txTweenedData, .frame == i)$nudge_x, family = "Open Sans", lineheight = 0.75) +
          labs(x=xLab, y=yLab, title = title, subtitle = subtitle,
                     caption = caption)
          print(g1);
        }

      # print the midpoint 75 times to create a pause
      g2 <- ggplot(data = subset(txTweenedData, .frame <= midPoint), aes(x = year, y = median, .frame = midPoint)) +
          geom_point(data = subset(txTweenedData, .frame == min(.frame)),aes(group=city, color=city), size=5) +
          geom_point(data = subset(txTweenedData, .frame == midPoint),aes(group=city, color=city), size=5) +
          geom_line(aes(group=city, color=city, cumulative = TRUE, label=LevelLabel), size=2.5) +
          scale_x_continuous(labels=xAxisBreaks, expand = c(0, 0), breaks=xAxisBreaks, limits =xAxisLimits) +
          scale_y_continuous(labels=yAxisLabels, expand = c(0, 0), breaks=yAxisBreaks,limits = yAxisLimits) +
          theme_minimal() + theme_white + scale_color_manual(values=my_palette) +
          geom_text(data = subset(txTweenedData, .frame == midPoint),aes(label =LevelLabel), size = 9, nudge_y = subset(txTweenedData, .frame == midPoint)$nudge_y, nudge_x = subset(txTweenedData, .frame == midPoint)$nudge_x, family = "Open Sans", lineheight = 0.75) +
          labs(x=xLab, y=yLab, title = title, subtitle = subtitle,
                     caption = caption)

      replicate(75,grid.draw(g2))

      # print from tue midpoint of the figure until the last frame
      for(i in midPoint:max(txTweenedData$.frame)) {
        g3 <- ggplot(data = subset(txTweenedData, .frame <= i), aes(x = year, y = median, .frame = i)) +
          geom_point(data = subset(txTweenedData, .frame == min(.frame)),aes(group=city, color=city), size=5) +
          geom_line(aes(group=city, color=city, cumulative = TRUE, label=LevelLabel), size=2.5) +
          scale_x_continuous(labels=xAxisBreaks, expand = c(0, 0), breaks=xAxisBreaks, limits =xAxisLimits) +
          scale_y_continuous(labels=yAxisLabels, expand = c(0, 0), breaks=yAxisBreaks,limits = yAxisLimits) +
          theme_minimal() + theme_white + scale_color_manual(values=my_palette) +
          geom_text(data = subset(txTweenedData, .frame == i),aes(label =LevelLabel), size = 9, nudge_y = subset(txTweenedData, .frame == i)$nudge_y, nudge_x = subset(txTweenedData, .frame == i)$nudge_x, family = "Open Sans", lineheight = 0.75) +
          labs(x=xLab, y=yLab, title = title, subtitle = subtitle,
                     caption = caption)
        print(g3);  }

      # print the final frame of the figure 110 times to create an ending pause
      wholeFig <- ggplot(data = subset(txTweenedData, .frame <= i), aes(x = year, y = median, .frame = i)) +
          geom_point(data = subset(txTweenedData, .frame == min(.frame)),aes(group=city, color=city), size=5) +
          geom_point(data = subset(txTweenedData, .frame == i),aes(group=city, color=city), size=5) +
          geom_line(aes(group=city, color=city, cumulative = TRUE, label=LevelLabel), size=2.5) +
          scale_x_continuous(labels=xAxisBreaks, expand = c(0, 0), breaks=xAxisBreaks, limits =xAxisLimits) +
          scale_y_continuous(labels=yAxisLabels, expand = c(0, 0), breaks=yAxisBreaks,limits = yAxisLimits) +
          theme_minimal() + theme_white + scale_color_manual(values=my_palette) +
          geom_text(data = subset(txTweenedData, .frame == i),aes(label =LevelLabel), size = 9, nudge_y = subset(txTweenedData, .frame == i)$nudge_y, nudge_x = subset(txTweenedData, .frame == i)$nudge_x, family = "Open Sans", lineheight = 0.75) +
          labs(x=xLab, y=yLab, title = title, subtitle = subtitle,
                     caption = caption)

      replicate(110,grid.draw(wholeFig))
    },movie.name="/home/michael/Documents/animation_samples/txHousing/txHousing.gif",interval = .02, ani.width = 1024, ani.height = 612)
Finally it’s smart to compress the final animation, since gifs can be unwieldy.
GIF Compression
    # compress gif
    gif_compress <- function(ingif, outgif, show=TRUE, extra.opts=""){
      command <-  sprintf("gifsicle -O3 %s < %s > %s", extra.opts, ingif, outgif)
      system.fun <- if (.Platform$OS.type == "windows") shell else system
      if(show) message("Executing: ", strwrap(command, exdent = 2, prefix = "\n"))
      system.fun(ifelse(.Platform$OS.type == "windows", sprintf(""%s"", shQuote(command)), command))
    }

    gif_compress("/home/michael/Documents/animation_samples/txHousing/txHousing.gif","/home/michael/Documents/animation_samples/txHousing/tx_Housing.gif",extra.opts="--colors 256")