Recreate a FiveThirtyEight Chicklet Stacked Bar Chart in ggplot2
Use ggchicklet and ggtext to recreate FiveThirtyEight's Stacked Bar Chart in ggplot2
Inspiration
Virtually following along with rstudio::conf 2020 (and having major
conference envy) I heard about Claus Wilke’s new package ggtext. The
package supports HTML and markdown styling for text and annotations in ggplot2 graphics. If you’re familiar with HTML or D3.js this seems
like a basic feature, but in R graphics this functionality is not
natively supported.
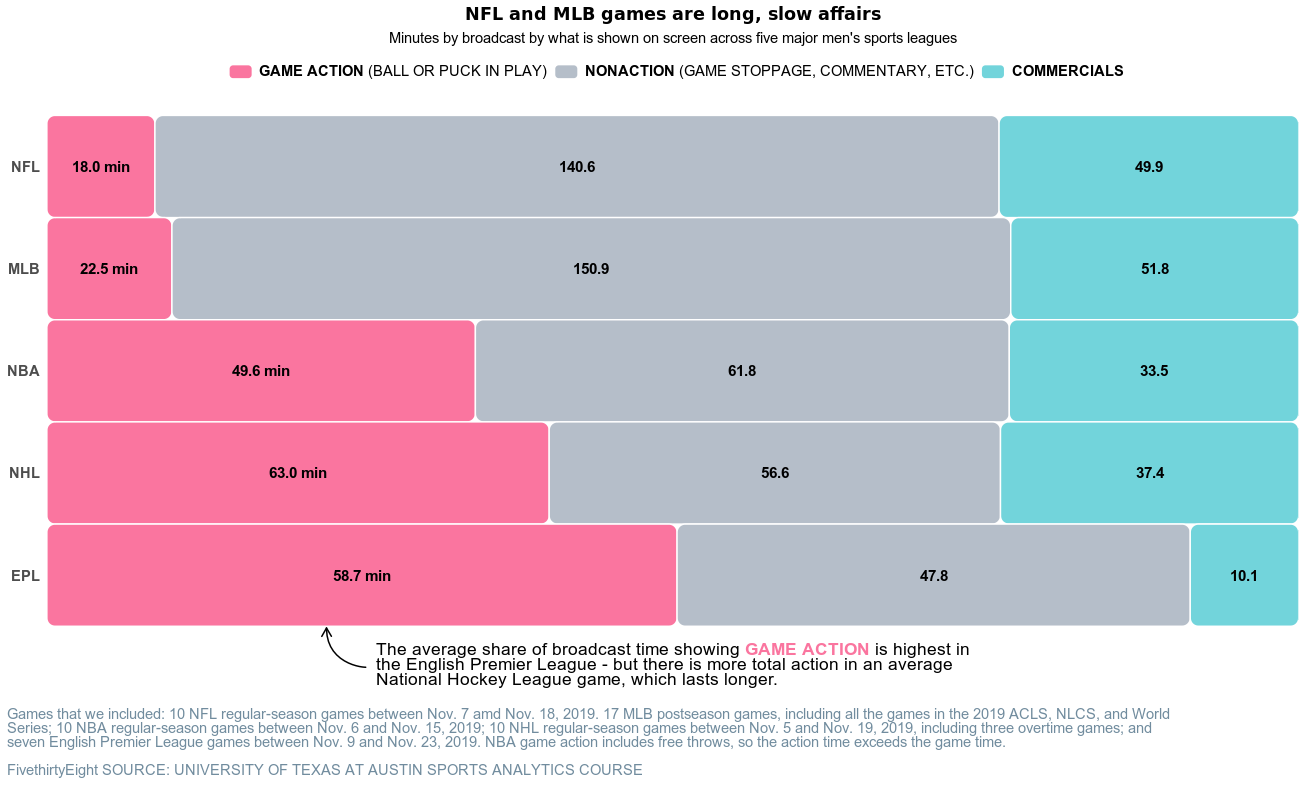
Reading this recent 538 article I noticed a neat stacked bar chart:
That reminded me of a recent package written by Bob Rudis used to create rounded edges in stacked bar charts (aka chicklets). Seemed like a perfect excuse to test out a couple new packages!
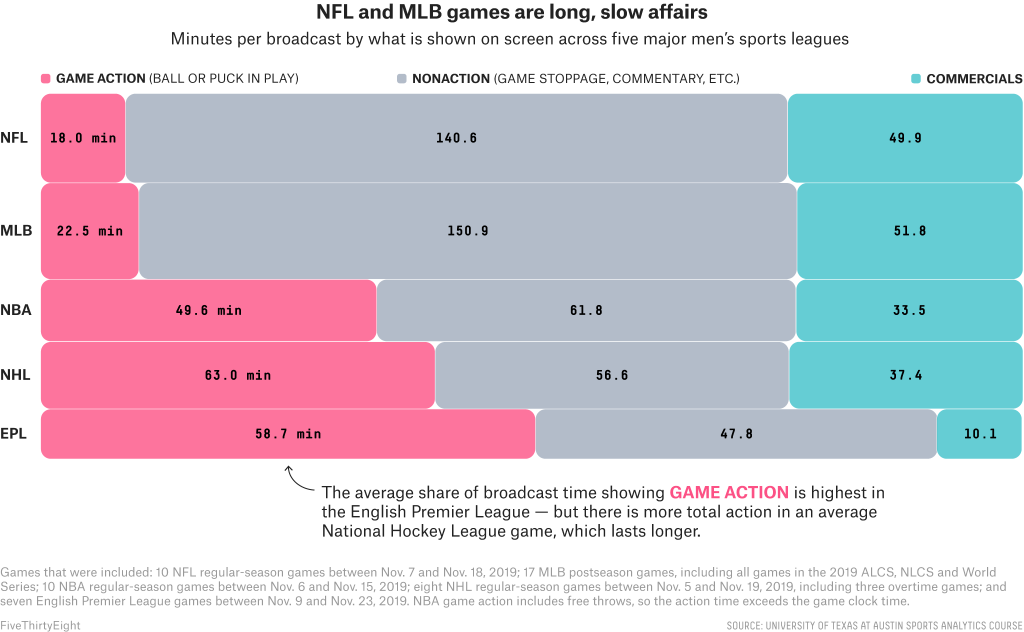
538 Chicklet Graph Code
538 Chicklet Graph Recreation Code
    # load libraries
    # devtools::install_github("tidyverse/ggplot2")
    library(ggplot2)
    library(ggchicklet)
    library(ggtext)
    library(dplyr)
    library(forcats)
    library(grid)

    # import data
    dat <- dat <- data.frame(
      Sport = c("NFL", "NFL", "NFL", "MLB", "MLB", "MLB", "NBA", "NBA",
                "NBA", "NHL", "NHL", "NHL", "EPL", "EPL", "EPL"),
      Type = c("Game Action", "Nonaction", "Commercials", "Game Action",
                "Nonaction", "Commercials", "Game Action", "Nonaction", "Commercials",
                "Game Action", "Nonaction", "Commercials", "Game Action", "Nonaction",
                "Commercials"),
      Time = c(18, 140.6, 49.9, 22.5, 150.9, 51.8, 49.6, 61.8,
               33.5, 63, 56.6, 37.4, 58.7, 47.8, 10.1),
      stringsAsFactors = FALSE)

    # refactor levels
    dat <- dat %>% group_by(Sport) %>% mutate(Percent = Time/sum(Time)) %>% ungroup() %>%
      mutate(Sport = fct_relevel(
        Sport,
        rev(c("NFL", "MLB", "NBA", "NHL", "EPL")))
      ) %>%
      mutate(Type = fct_relevel(
        Type,
        c("Commercials","Nonaction","Game Action"))
      )

    # keep trailing zeroes and add "min" to first bar value labels
    dat$Label <- as.character(sprintf("%.1f", dat$Time))
    dat$Label <- ifelse(dat$Type == "Game Action", paste0(dat$Label, " min"), dat$Label)

    # generate plot
    gg <- ggplot(dat, aes(Sport, Percent,  fill = Type, label = Label)) +
      geom_chicklet(width = 1,radius = unit(6,units = "pt"), position = ggplot2::position_stack(reverse = FALSE)) +
      geom_text(size = 4, fontface= "bold", position = position_stack(vjust = 0.5)) +
      scale_y_continuous(limits = c(0,1),expand = c(0, 0)) +  coord_flip() +
      theme_minimal() +
      theme(
            legend.position = "top",
            plot.title = element_markdown(hjust =0.5),
            plot.subtitle = element_markdown(hjust = 0.5),
            plot.caption = element_markdown(hjust = 0, size = 11, margin = unit(c(0, 0, 0, 0), "cm"), color = "#718c9e"),
            legend.text = element_markdown(size = 11),
            axis.text = element_text(face = "bold", size = 11),
            axis.text.x = element_blank(),
            axis.title.y = element_markdown(hjust = 0, size = 20, margin = unit(c(0, 0, 0, 0), "cm"), color = "#718c9e"),
            panel.grid = element_blank(),
            axis.title.x = element_markdown(
              halign = 0,
              margin = margin(2, 0, 15, 0),
              fill = "transparent"
            )

      ) +
      scale_fill_manual(
        name = NULL,
        values = c(`Game Action` = "#FA759F", Nonaction = "#B5BEC9", Commercials = "#72D4DB"),
        labels = c(
          # `Game Action` = "<strong style='color:#FA759F'>GAME ACTION</strong> (BALL OR PUCK IN PLAY)",
          # Nonaction = "<strong style='color:#B5BEC9'>NONACTION</strong> (GAME STOPPAGE, COMMENTARY, ETC.)",
          # Commercials = "<strong style='color:#72D4DB'>COMMERCIALS</strong>")
          `Game Action` = "<strong>GAME ACTION</strong> (BALL OR PUCK IN PLAY)",
          Nonaction = "<strong>NONACTION</strong> (GAME STOPPAGE, COMMENTARY, ETC.)",
          Commercials = "<strong>COMMERCIALS</strong>"),
        guide = guide_legend(reverse = TRUE)
      ) +
      labs(
        y = "<span style='font-size:13pt;'>The average share of broadcast time showing <strong style='color:#FA759F'>GAME ACTION</strong> is highest in<br>the English Premier League - but there is more total action in an average<br>National Hockey League game, which lasts longer.</span>",    x = NULL, fill = NULL,
        title = "<b>NFL and MLB games are long, slow affairs</b>",
        subtitle = "Minutes by broadcast by what is shown on screen across five major men's sports leagues",
        caption = "Games that we included: 10 NFL regular-season games between Nov. 7 amd Nov. 18, 2019. 17 MLB postseason games, including all the games in the 2019
        ACLS, NLCS, and World<br>Series; 10 NBA regular-season games between Nov. 6 and Nov. 15, 2019; 10 NHL regular-season games between Nov. 5 and Nov. 19, 2019, including three overtime games;
        and<br>seven English Premier League games between Nov. 9 and Nov. 23, 2019. NBA game action includes free throws, so the action time exceeds the game time.<br>
        <br>
        FiveThirtyEight SOURCE: UNIVERSITY OF TEXAS AT AUSTIN SPORTS ANALYTICS COURSE"
      )


    alignTitles <- function(ggplot, title = NULL, subtitle = NULL, caption = NULL) {
      # grab the saved ggplot2 object
      g <- ggplotGrob(ggplot)


      # find the object which provides the plot information for the title, subtitle, and caption
      if(!is.null(title)) {
        g$layout[which(g$layout$name == "title"),]$l <- title
      }
      if(!is.null(subtitle)) {
        g$layout[which(g$layout$name == "subtitle"),]$l <- subtitle
      }
      if(!is.null(caption)) {
        g$layout[which(g$layout$name == "caption"),]$l <- caption
      }
      g
    }

    # align caption to y axis value labels
    gg2 <- alignTitles(gg, caption = 2)
    grid.draw(gg2)

    # add arrow
    x <- rev(c(0.25, 0.25, 0.28, 0.28))
    y <- rev(c(0.2, 0.15, 0.15, 0.15))
    grid.bezier(x, y, gp=gpar(lwd=1.5, fill="black"),
                arrow=arrow(type="open",length = unit(0.1, "inches")))