🌚 Dark
🌝 Light
← Home
Animation
2020
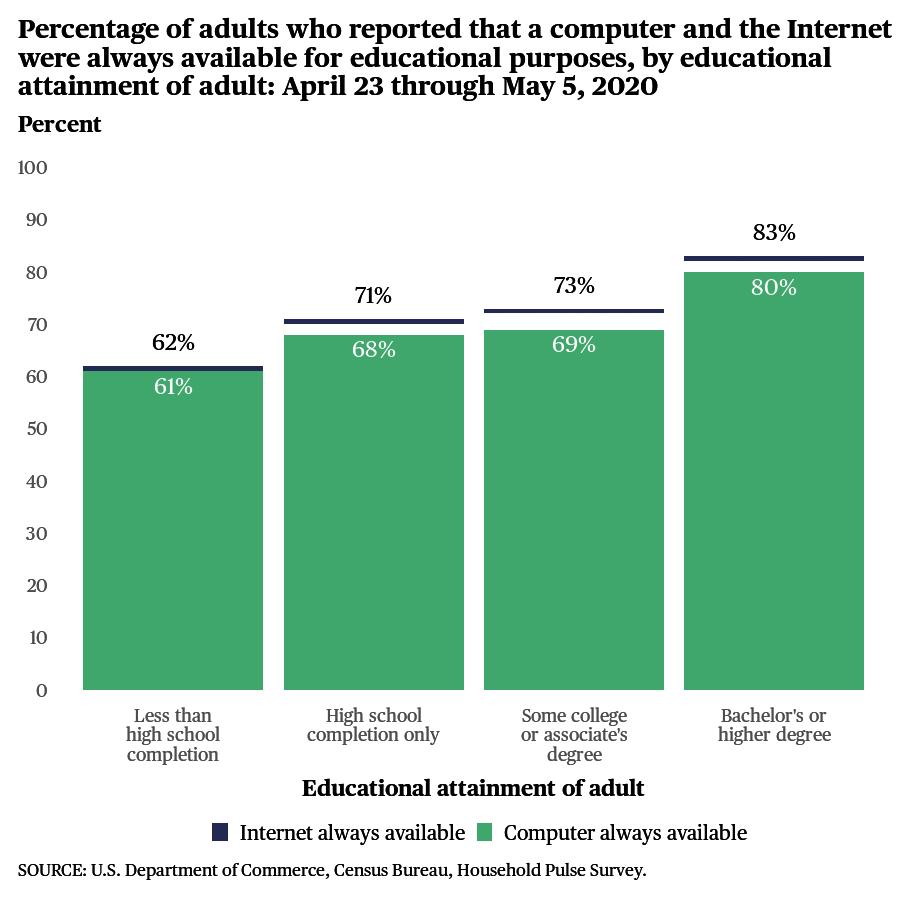
Bar Chart - Parent Educational Attainment
Adults with higher levels of education reported that computers and the Internet were always available for educational purposes for elementary and secondary students in their households at a higher percentage than adults with lower levels of education.
animation
dataviz
ggplot2
gganimate
R
NCES
bar
2020
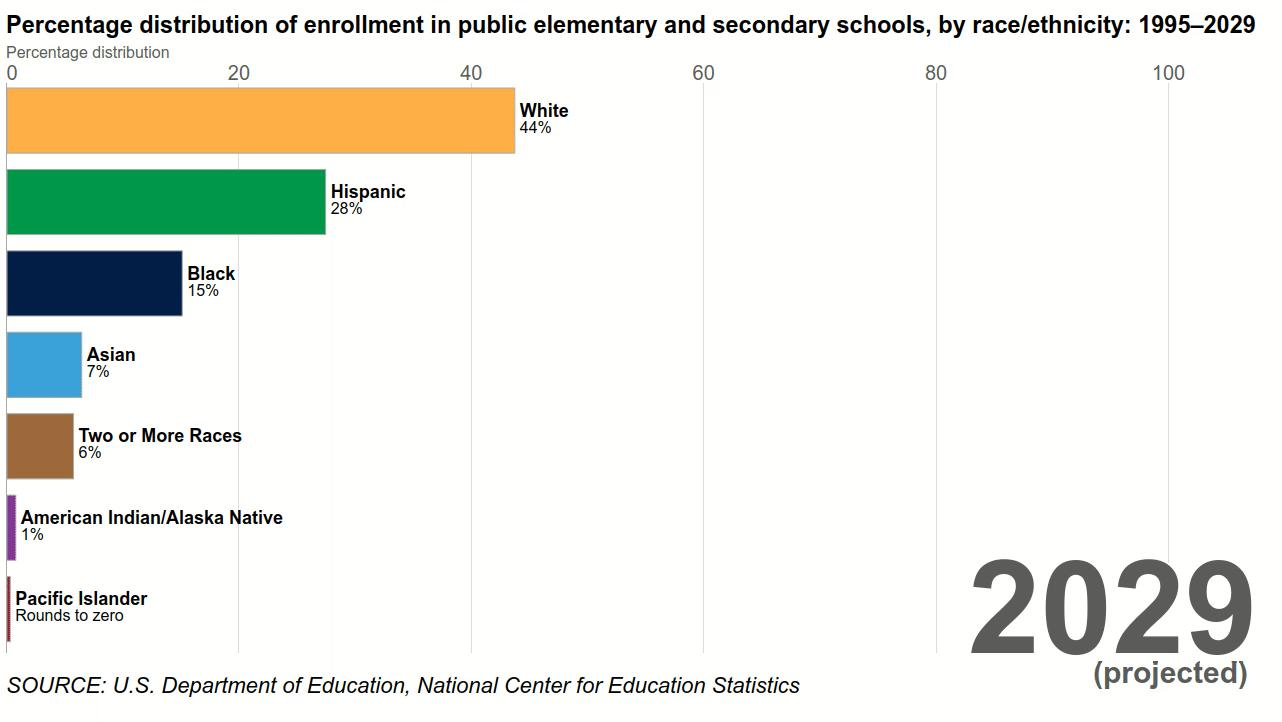
Bar Chart Race - Changing Demographics in K–12 Public School Enrollment
Total enrollment in public elementary and secondary schools has grown since 1995, but it has not grown across all racial/ethnic groups. As such, racial/ethnic distributions of public school students across the country have shifted.
animation
dataviz
ggplot2
gganimate
R
NCES
bar
2020
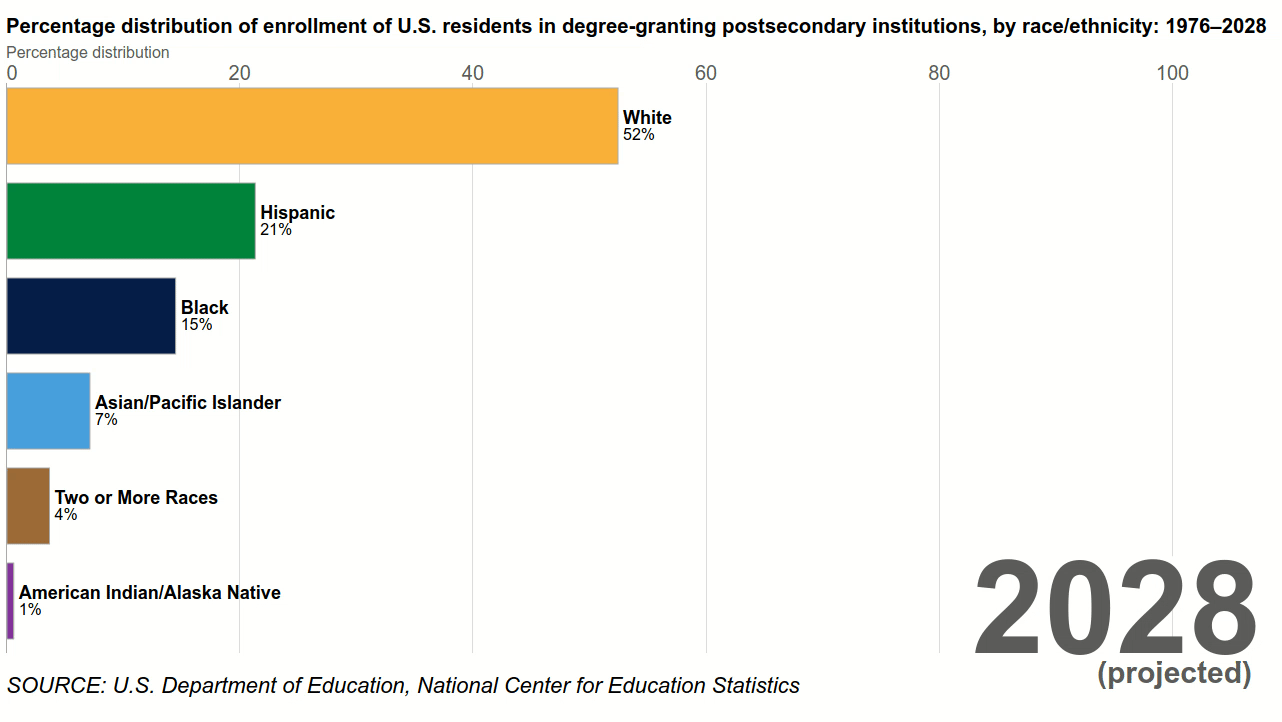
Bar Chart Race - Changing Demographics in Postsecondary Enrollment
Fall enrollment of U.S. residents in degree-granting postsecondary institutions from 1976 to 2028 by race/ethnicity.
animation
dataviz
ggplot2
gganimate
R
NCES
racingbar
2020
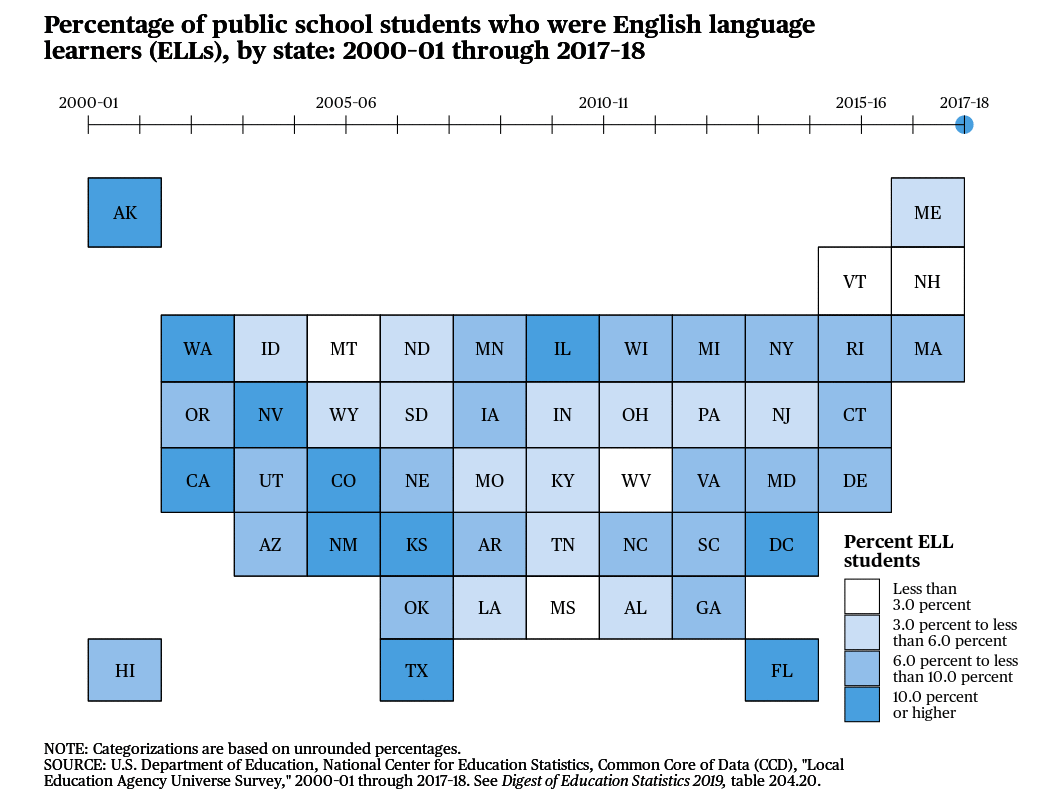
State Map - Adjusted Cohort Graduation Rate (2020 update)
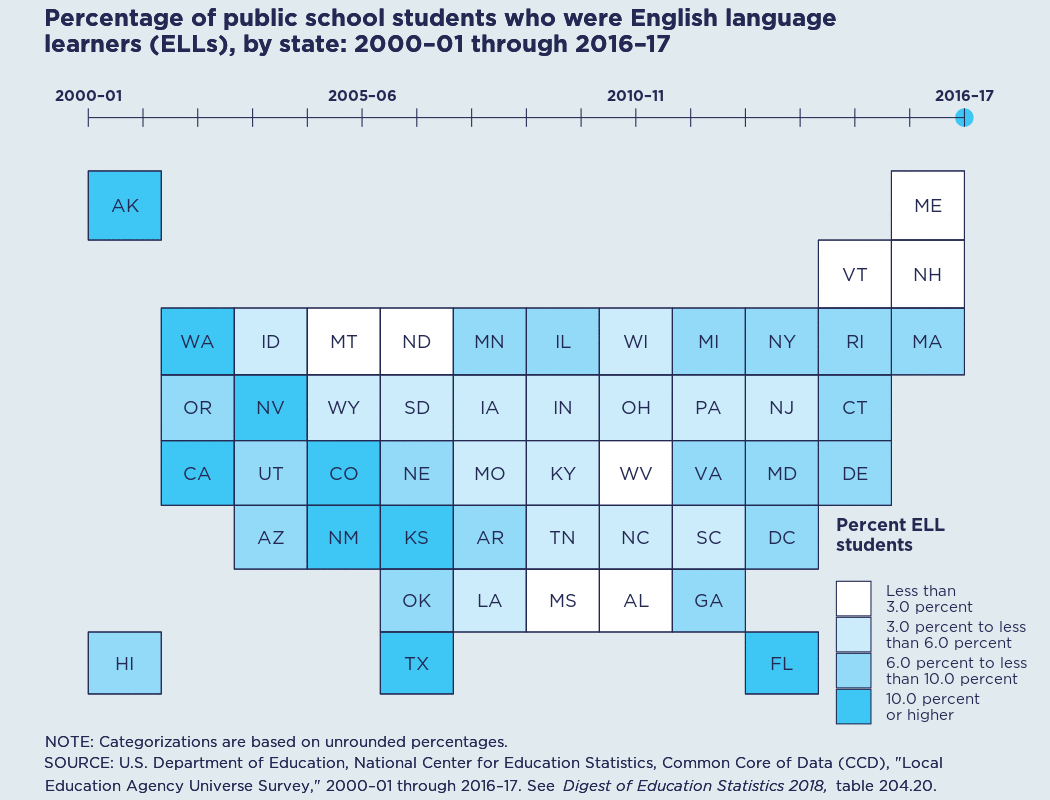
The % of public school students in the U.S. who were English language learners (#ELL) was higher in fall 2017 (10.1%, or 5M) than in fall 2000 (8.1%, or 3.8M).
animation
dataviz
ggplot2
gganimate
R
NCES
gridmap
2020
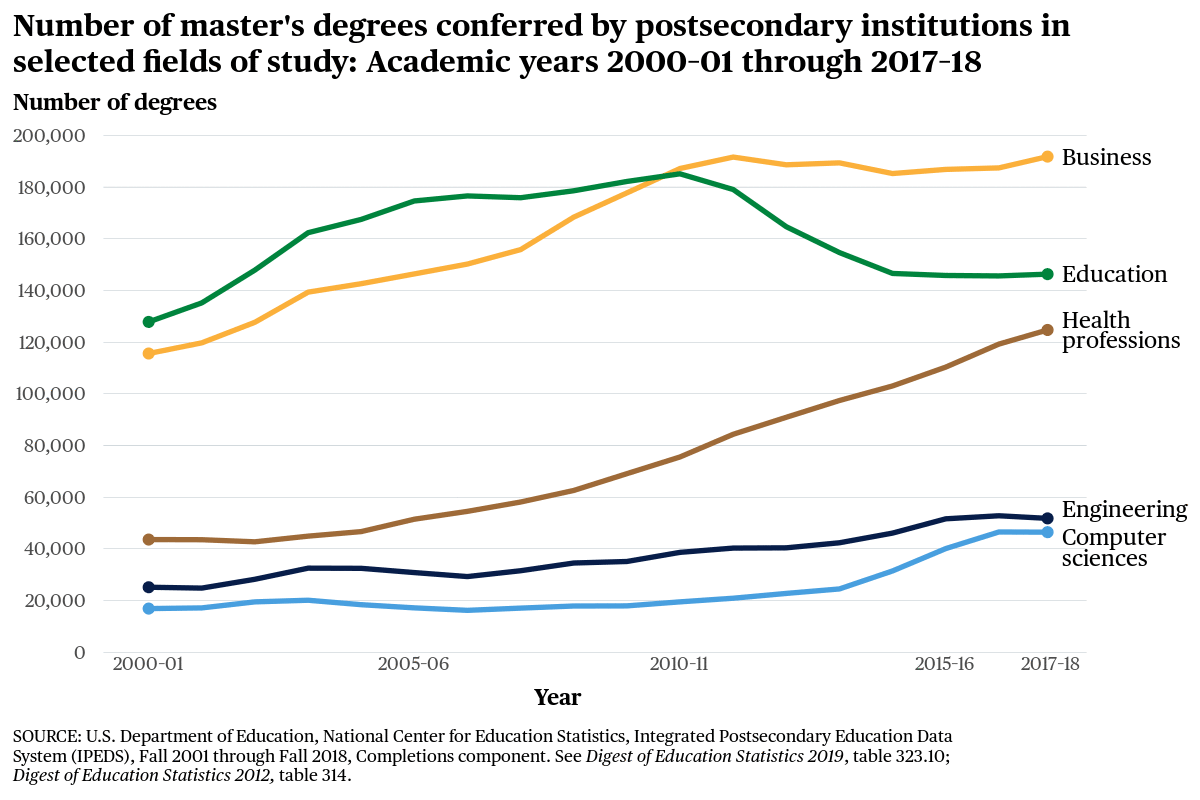
Line Chart - Master's Degrees Conferred
In 2010–11, business surpassed #education as the field in which the largest number of master’s degrees were conferred and has remained the largest field in each subsequent year.
animation
dataviz
ggplot2
gganimate
R
NCES
line
2020
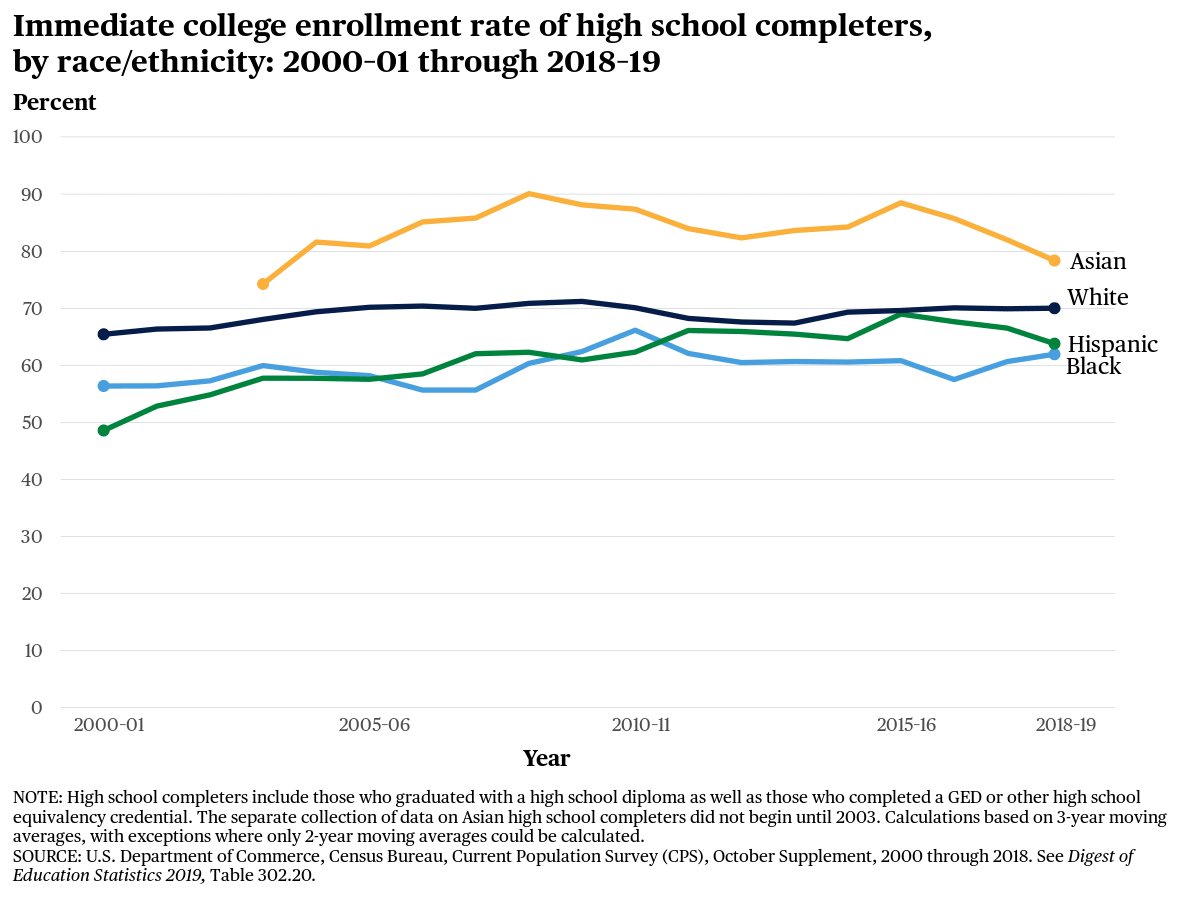
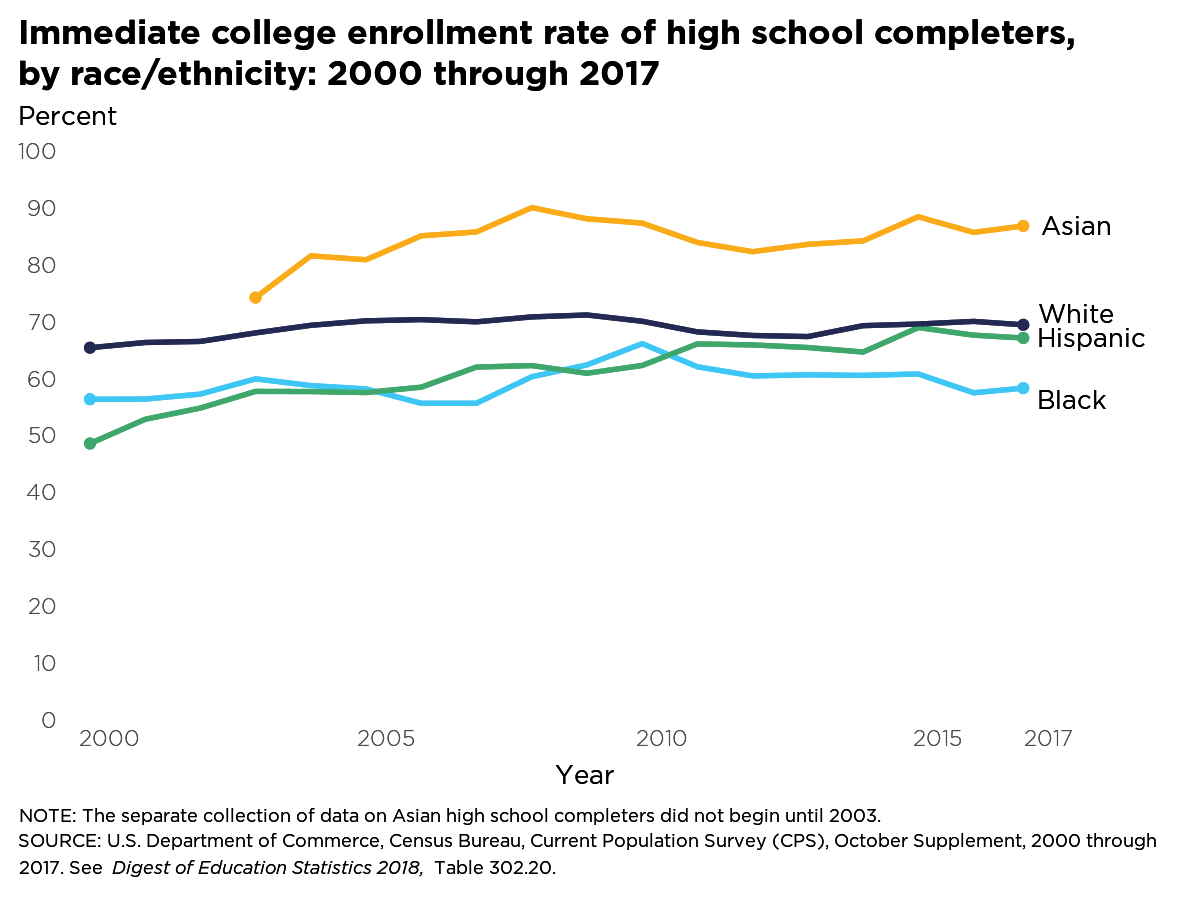
Line Chart - College Enrollment Rate (2020 update)
The immediate #CollegeEnrollment rate for Hispanic students was higher in 2018 (63%) than in 2000 (49%).
animation
dataviz
ggplot2
gganimate
R
NCES
line
2020
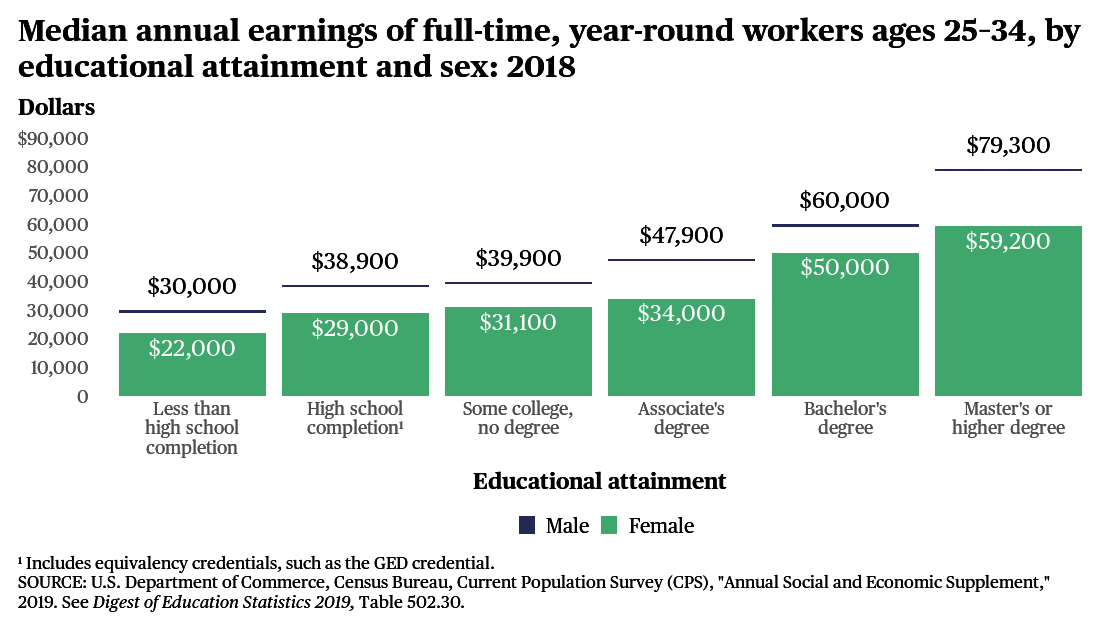
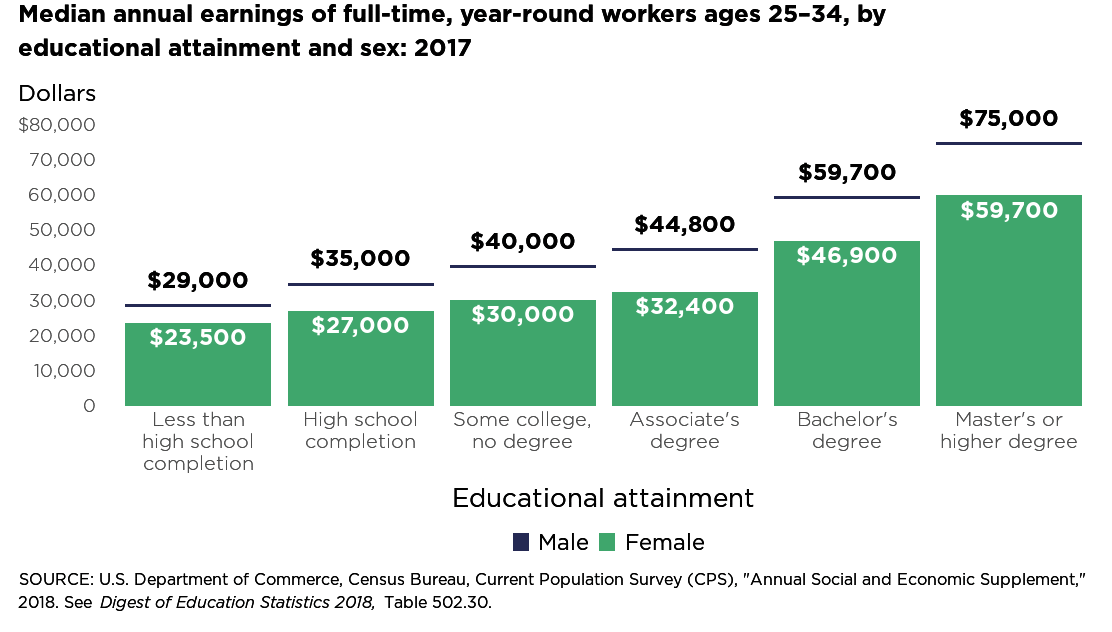
Bar Chart - Median Annual Earnings (2020 update)
How did the median annual earnings of full-time, year-round workers ages 25–34 vary by sex and educational attainment? Dive into the #ConditionOfEd for more #EdStats
animation
dataviz
ggplot2
gganimate
R
NCES
bar
2020
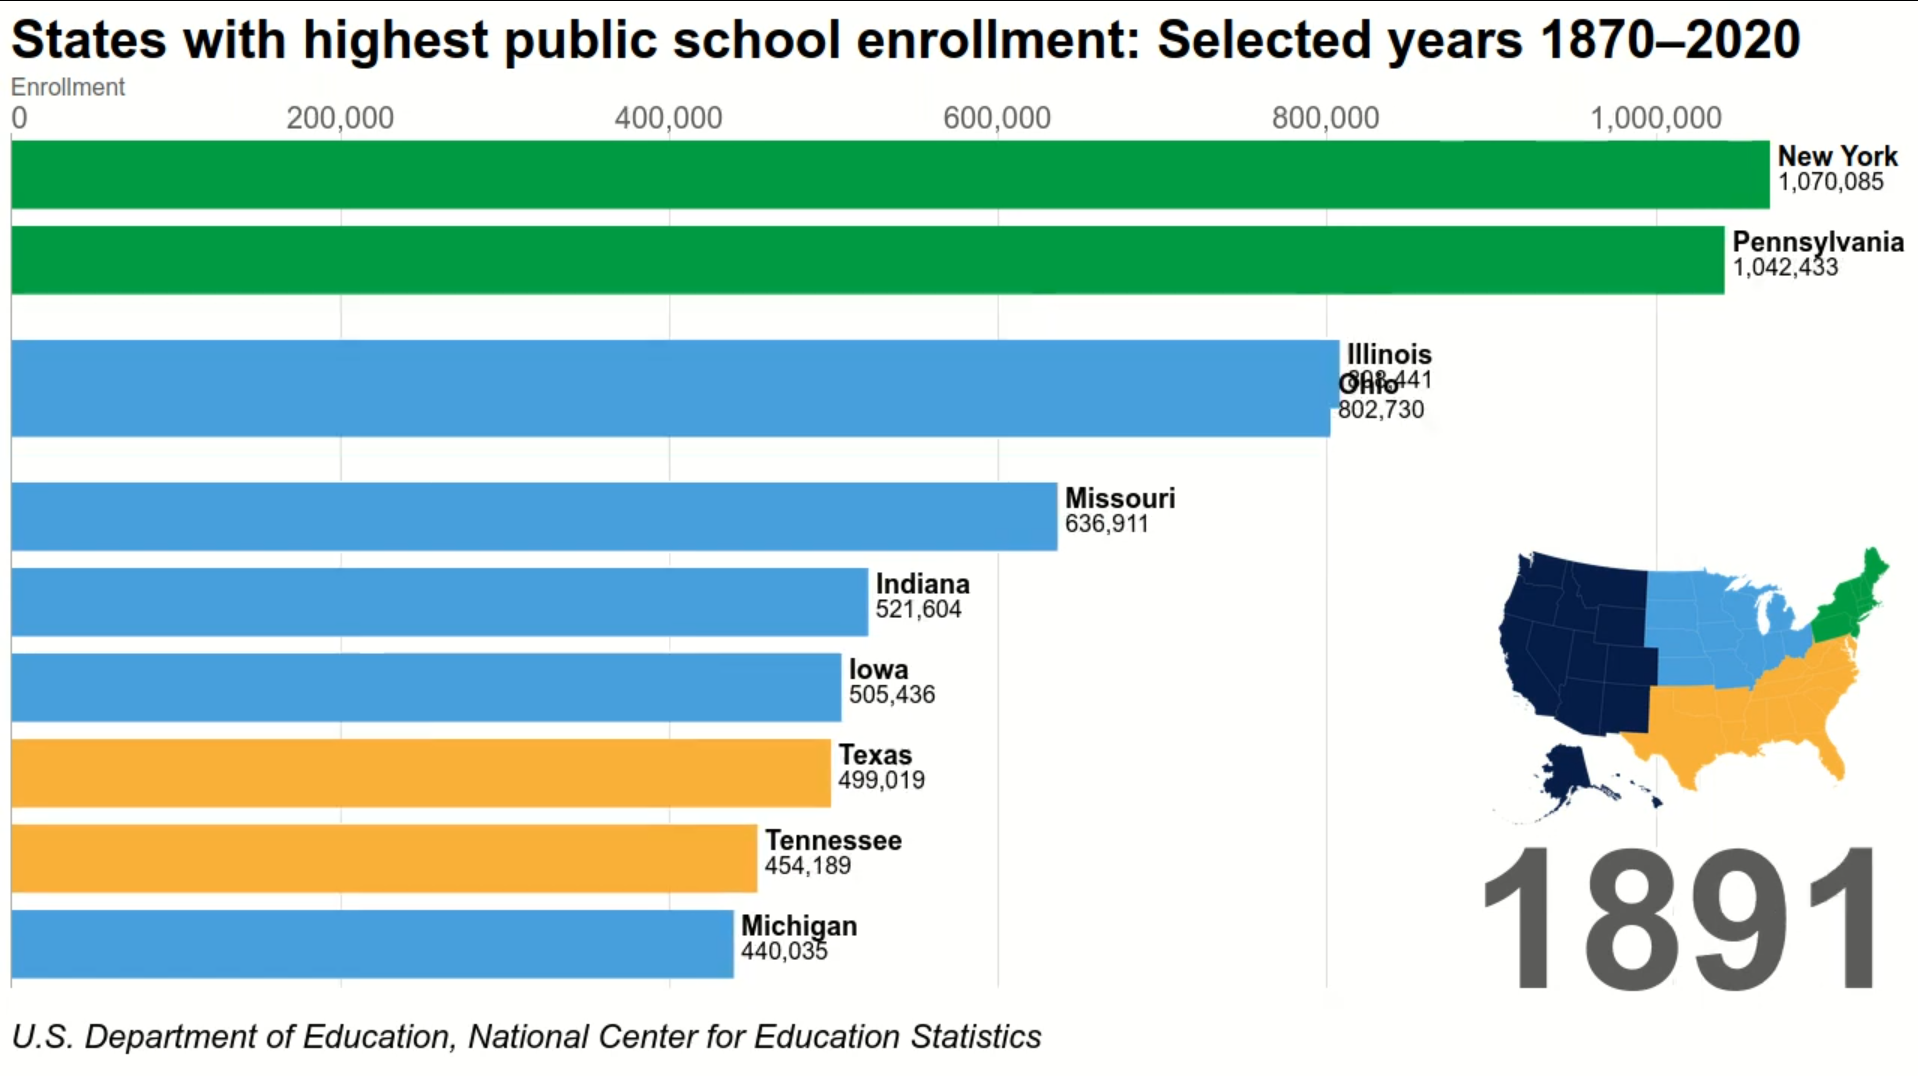
Bar Chart Race - States With the Highest Public School Enrollment
Since 1870, states populations and public school enrollment have increased, with differential growth across the country.
animation
dataviz
ggplot2
gganimate
R
NCES
barchartrace
2020
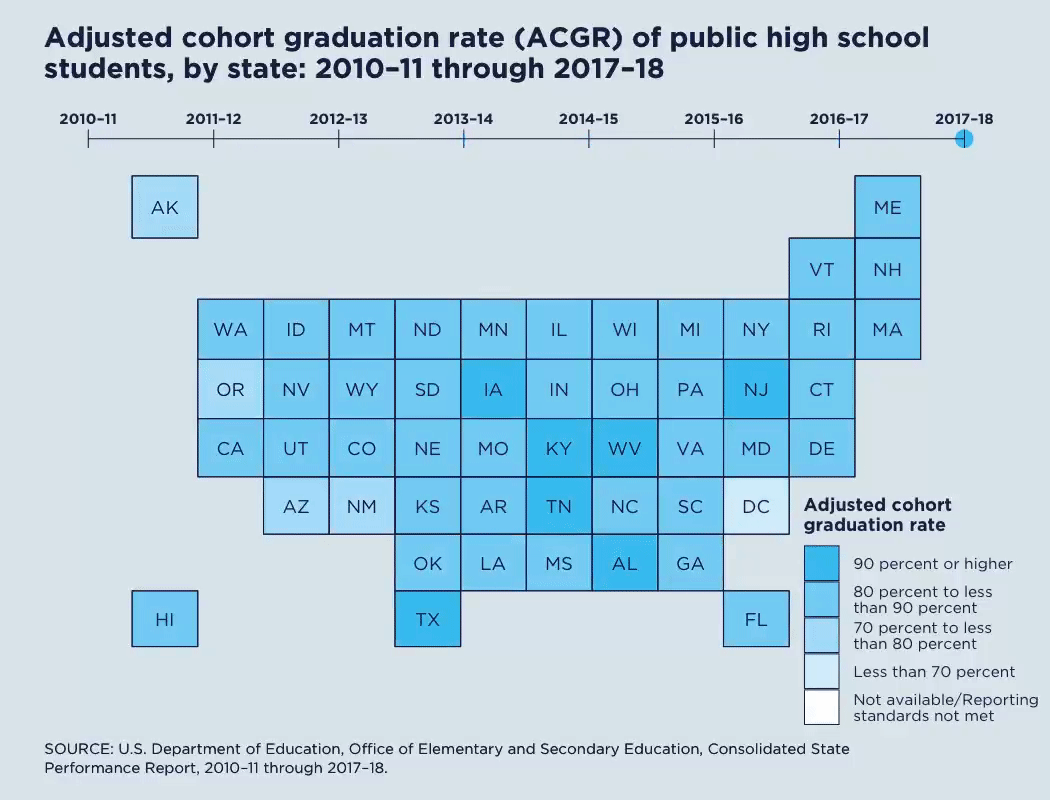
State Map - Adjusted Cohort Graduation Rate (2020 update)
The adjusted cohort #GraduationRate (ACGR) is the % of public high school students who graduate w/ a regular diploma within 4 yrs of starting 9th grade for the first time.
animation
dataviz
ggplot2
gganimate
R
NCES
gridmap
2019
State Map - Adjusted Cohort Graduation Rate
The % of public school students in the U.S. who were English language learners (#ELL) was higher in fall 2016 (9.6%, or 4.9M) than in fall 2000 (8.1%, or 3.8M).
animation
dataviz
ggplot2
gganimate
R
NCES
gridmap
2019
Bar Chart - Median Annual Earnings
How did the median annual earnings of full-time, year-round workers ages 25–34 vary by sex and educational attainment? Dive into the #ConditionOfEd for more #EdStats
animation
dataviz
ggplot2
gganimate
R
NCES
bar
2019
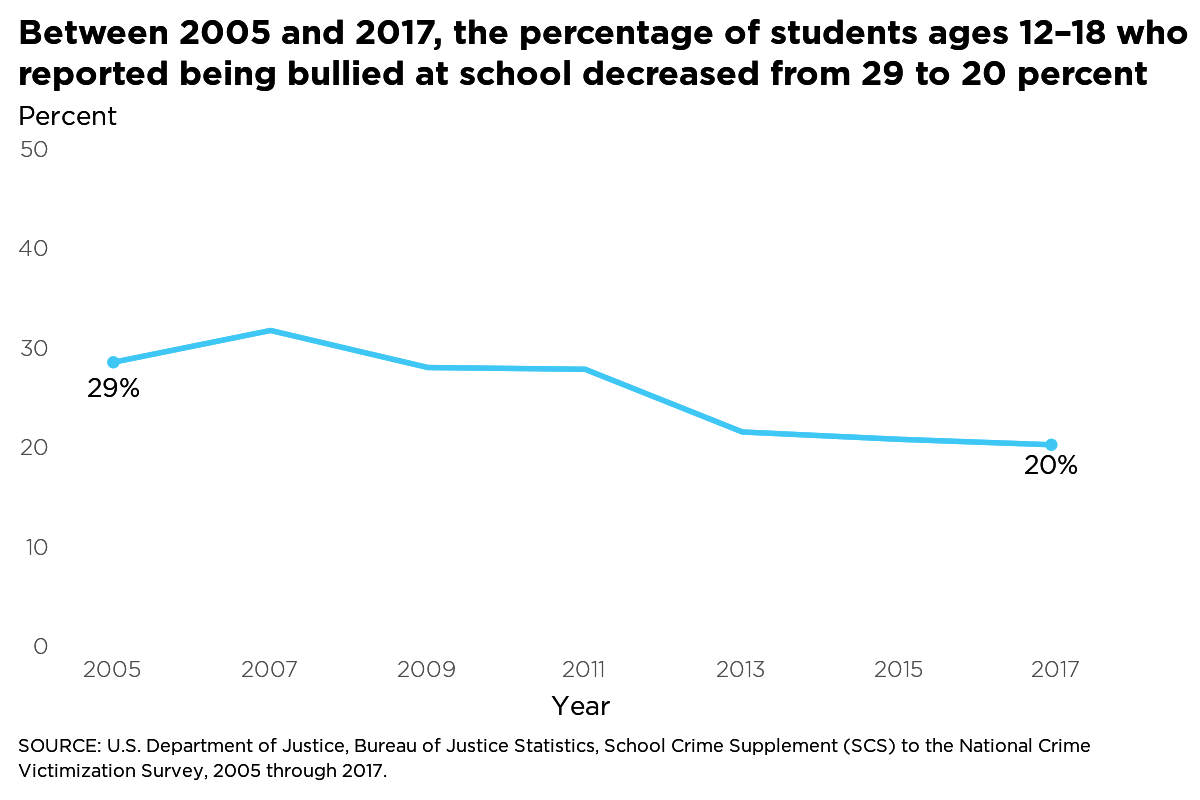
Line Chart - Percentage of Students Reporting Being Bullied
Between 2005 and 2017, the percentage of students ages 12-18 who reported being bullied at school decreased from 29 to 20 percent
animation
dataviz
ggplot2
gganimate
R
NCES
line
2019
Line Chart - College Enrollment Rate
The immediate college enrollment rate for #Hispanic students was higher in 2017 (67%) than in 2000 (49%).
animation
dataviz
ggplot2
gganimate
R
NCES
line
2019
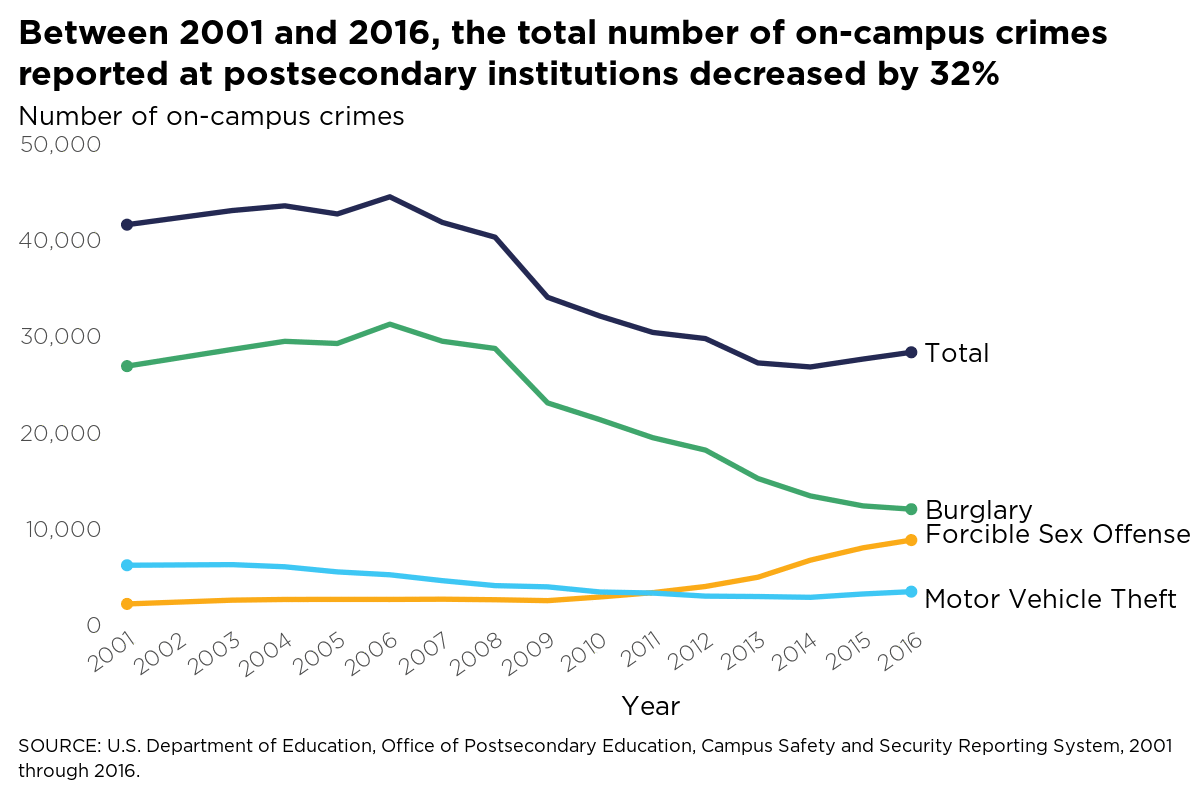
Line Chart - On Campus Crimes
Between 2001 and 2016, the total number of on-campus crimes reported at postsecondary institutions decreased by 32%
animation
dataviz
ggplot2
gganimate
R
NCES
line
2019
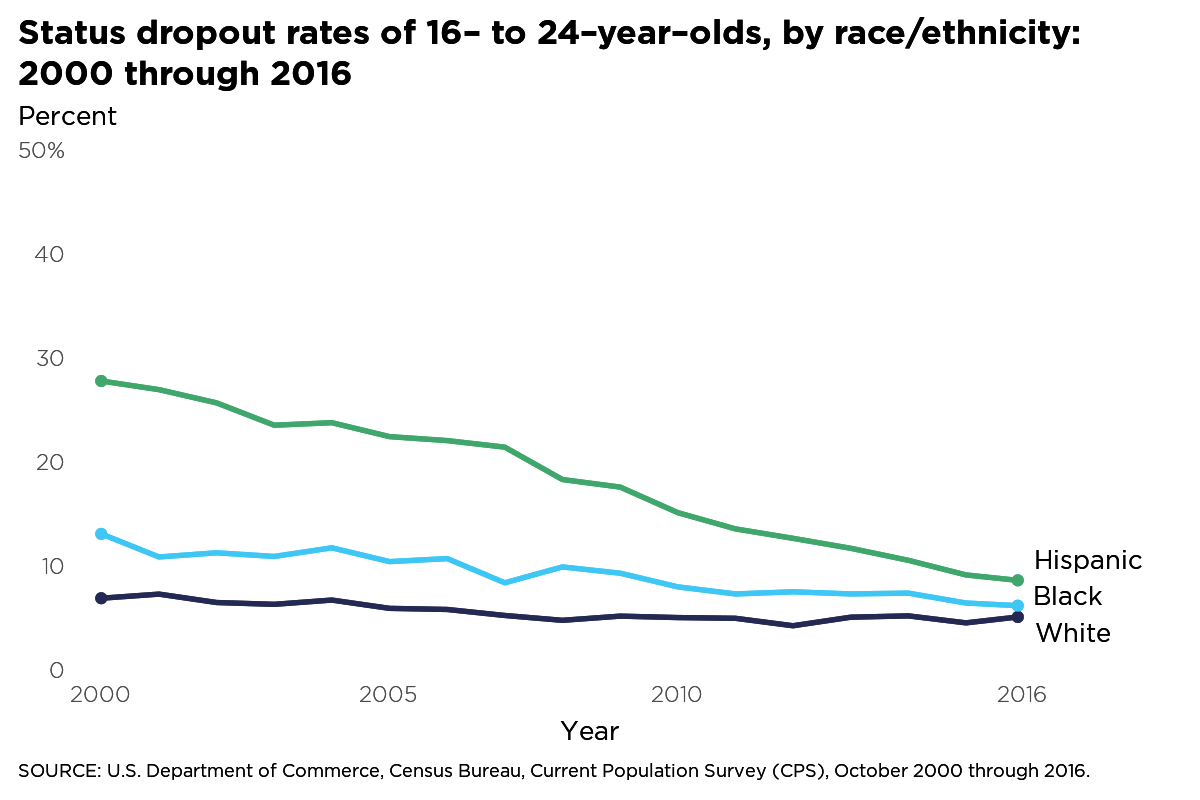
Line Chart - Status Dropout Rate
Status dropout rates of 16 to 24 year olds, by race/ethnicity: 2000 through 2016
animation
dataviz
ggplot2
gganimate
R
NCES
line
2019
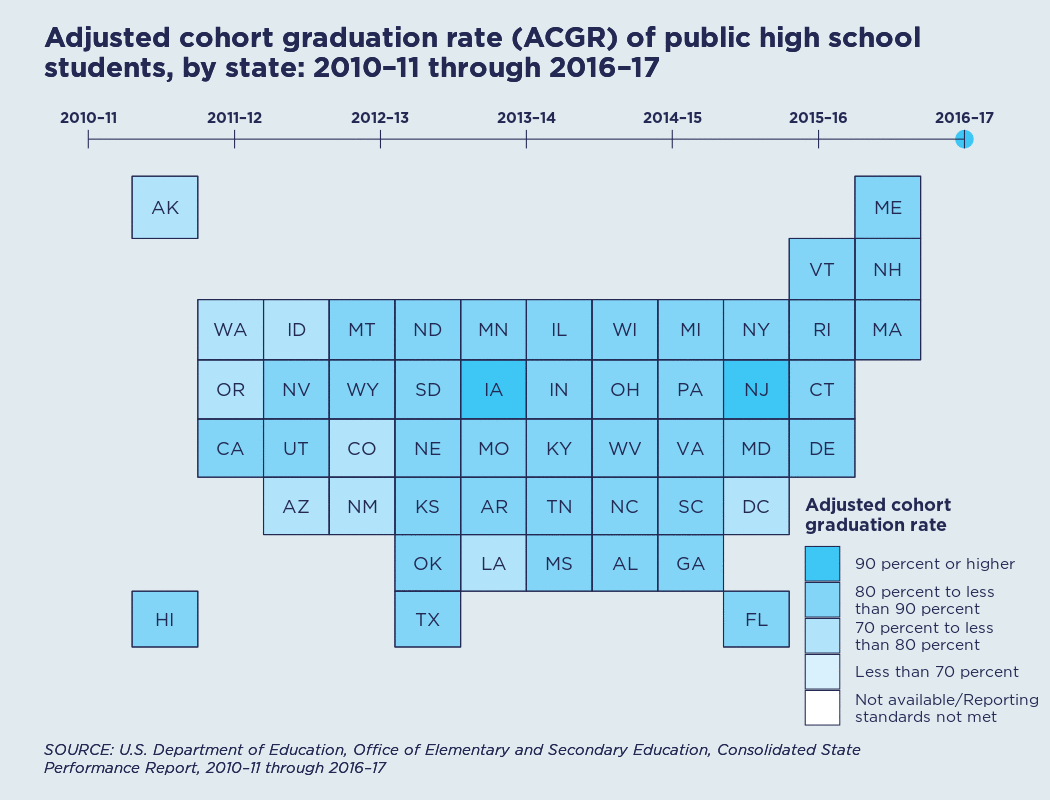
State Map - Adjusted Cohort Graduation Rate
Adjusted cohort graduation rate (ACGR) of public high school students, by state: 2010-11 through 2016-17
animation
dataviz
ggplot2
gganimate
R
NCES
gridmap
2018
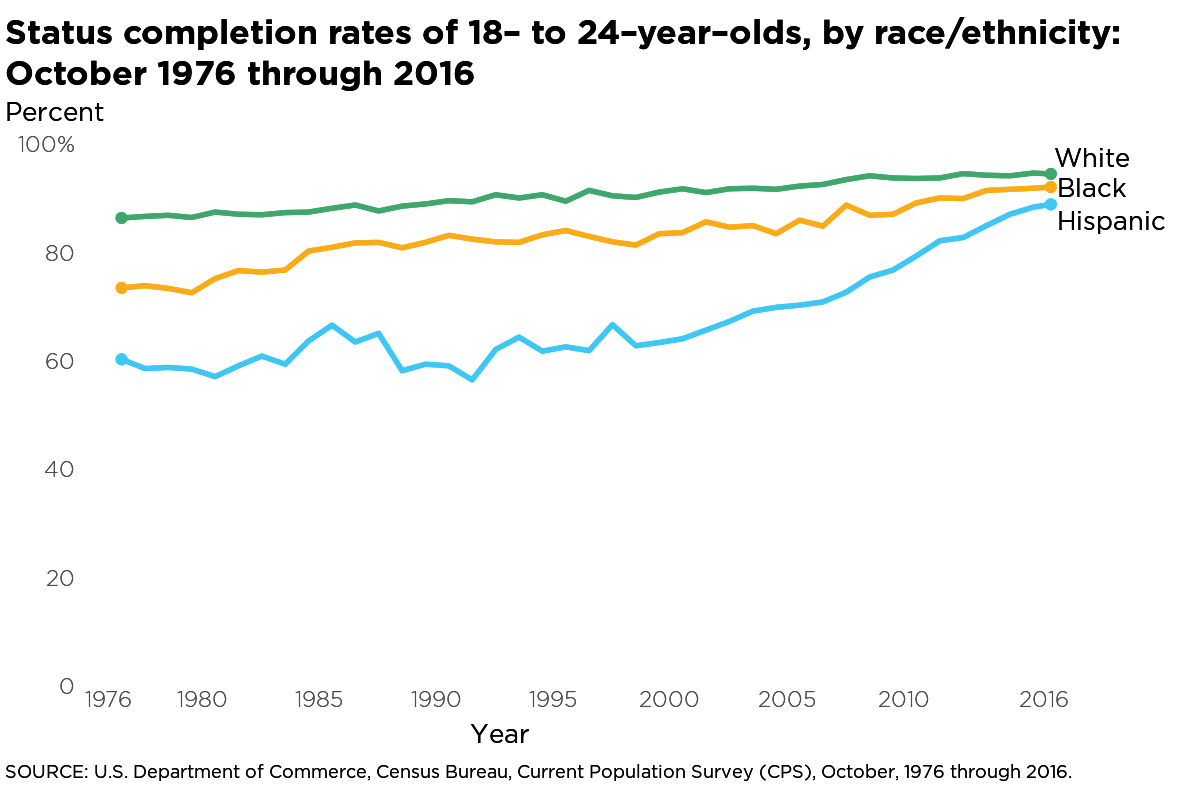
Line Chart - Status Completion Rate
Status completion rates of 18 to 24 year olds, by race/ethnicity: October 1976 through 2016
animation
dataviz
ggplot2
gganimate
R
NCES
line
2018
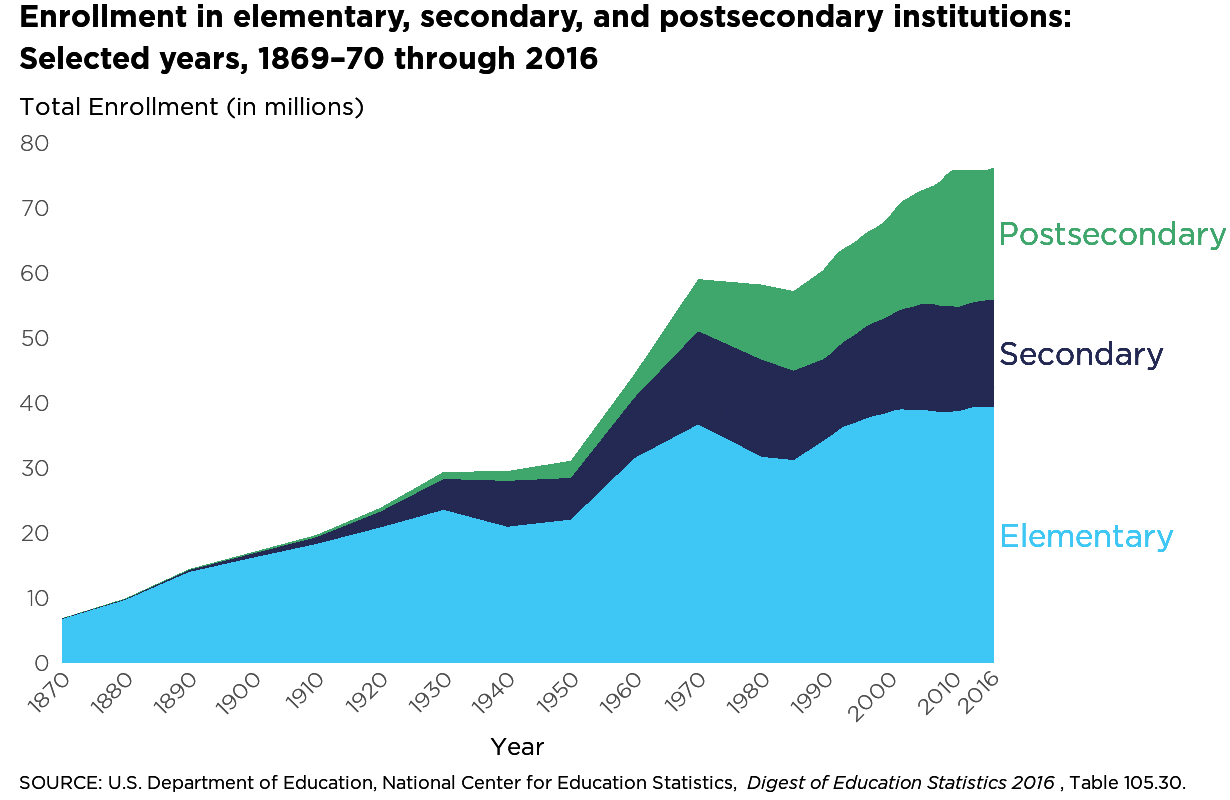
Stacked Area Chart - US Education Enrollment
Enrollment in elementary, secondary, and postsecondary institutions: Selected years, 1869-70 through 2016
animation
dataviz
ggplot2
gganimate
R
NCES
stackedarea
2018
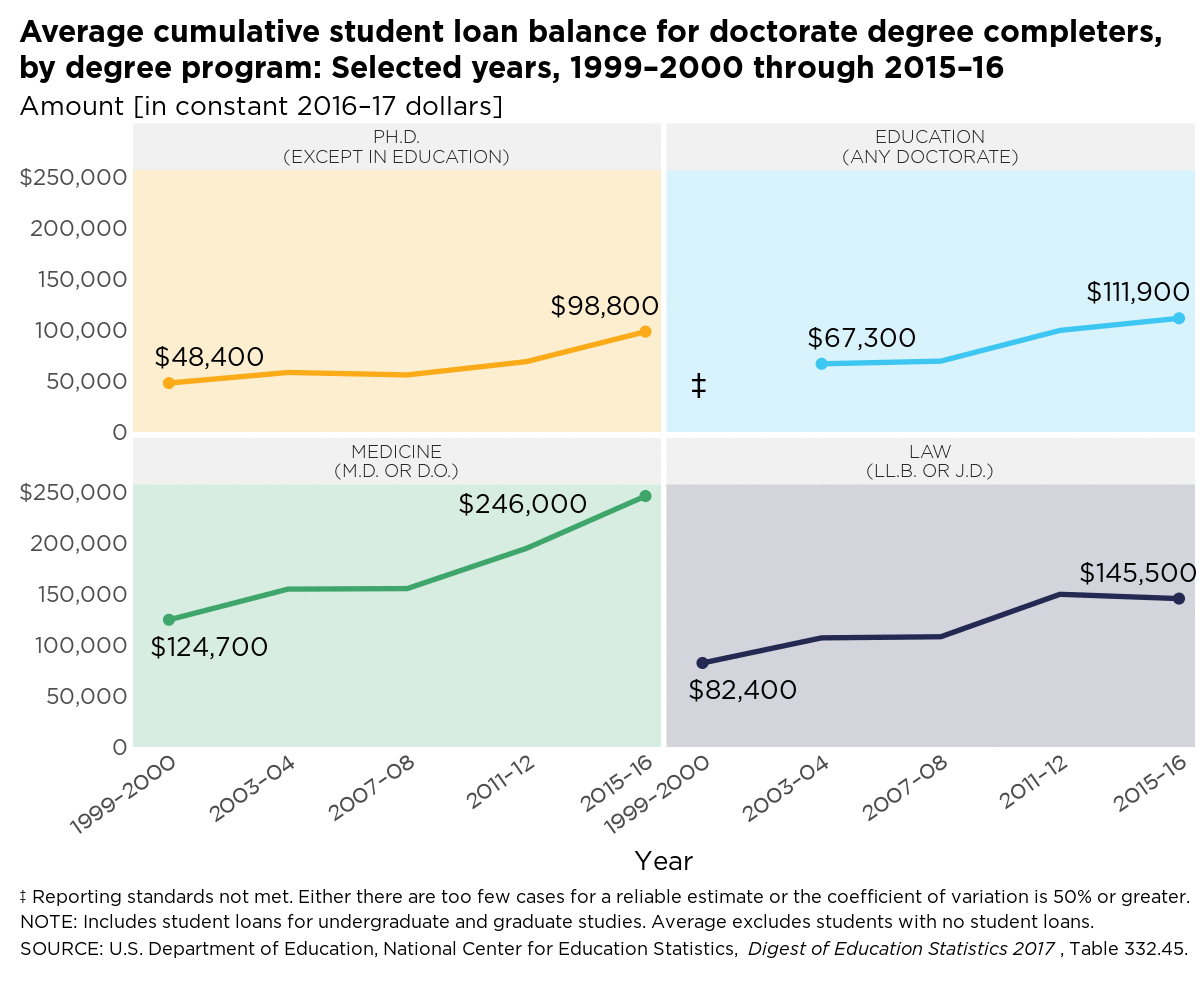
Average cumulative student loan balance for doctorate degree completers, by degree program: Selected years, 2000–2016
Between 1999–2000 & 2015–16, average student loan debt for medical doctorate completers increased by 97% (from $124,700 to $246,000).
animation
dataviz
ggplot2
gganimate
R
NCES
line
2018
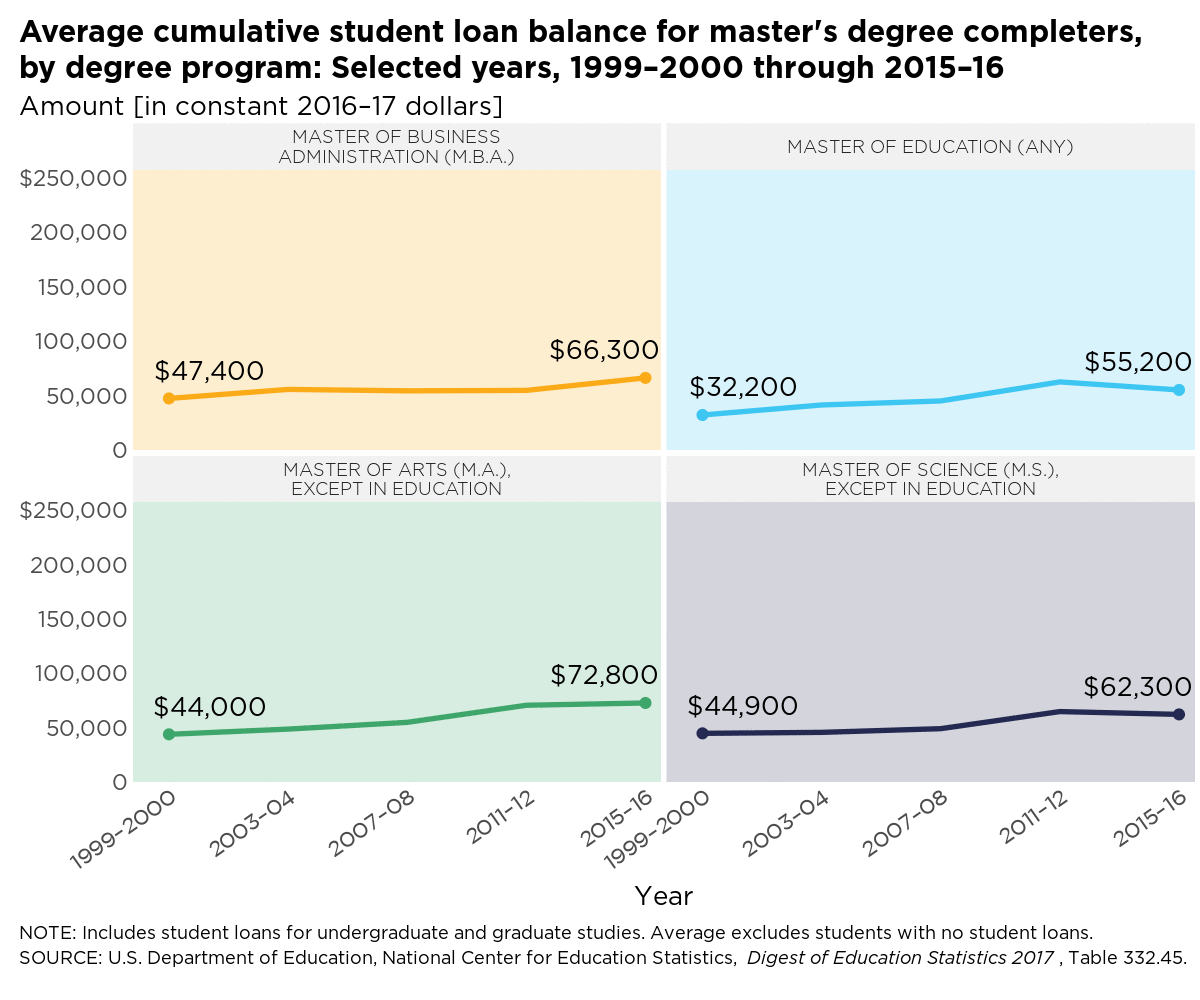
Average cumulative student loan balance for master's degree completers, by degree program: Selected years, 2000–2016
Average student loan balances were higher in 2015–16 than in 1999–2000 for all master’s degree fields.
animation
dataviz
ggplot2
gganimate
R
NCES
line
2018
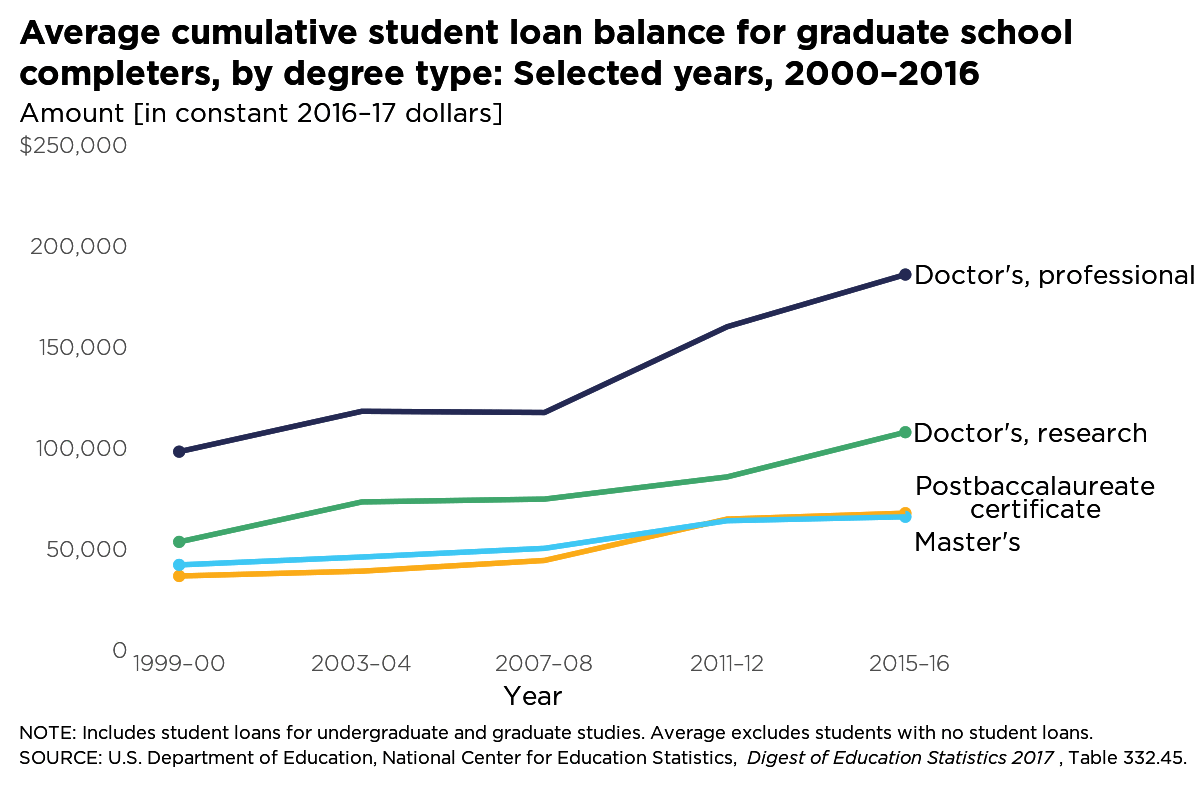
Average cumulative student loan balance for graduate school completers, by degree type: Selected years, 2000-2016
Among grad school completers in 2015-16 who took out student loans, the avgerage balance was highest for those completing a professional doctorate ($186,600).
animation
dataviz
ggplot2
gganimate
R
NCES
line
2018
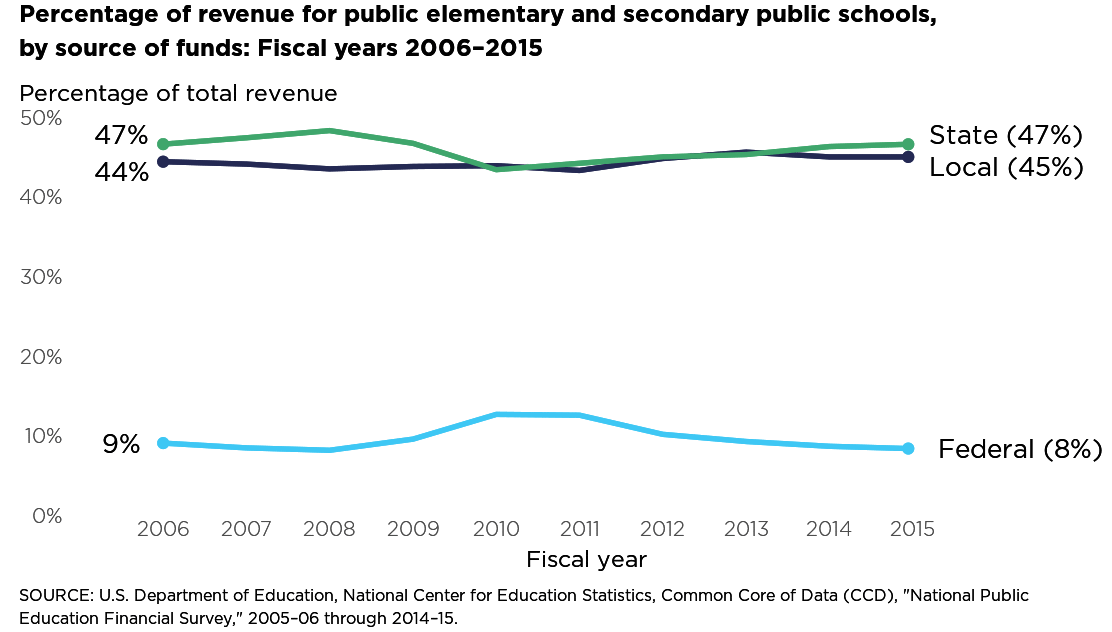
Percentage of revenue for elementary and secondary public schools
Federal sources accounted for approx. 9% of the total funding for #K12 public schools in both 2005–06 and 2014 –15.
animation
dataviz
ggplot2
gganimate
R
NCES
line
2018
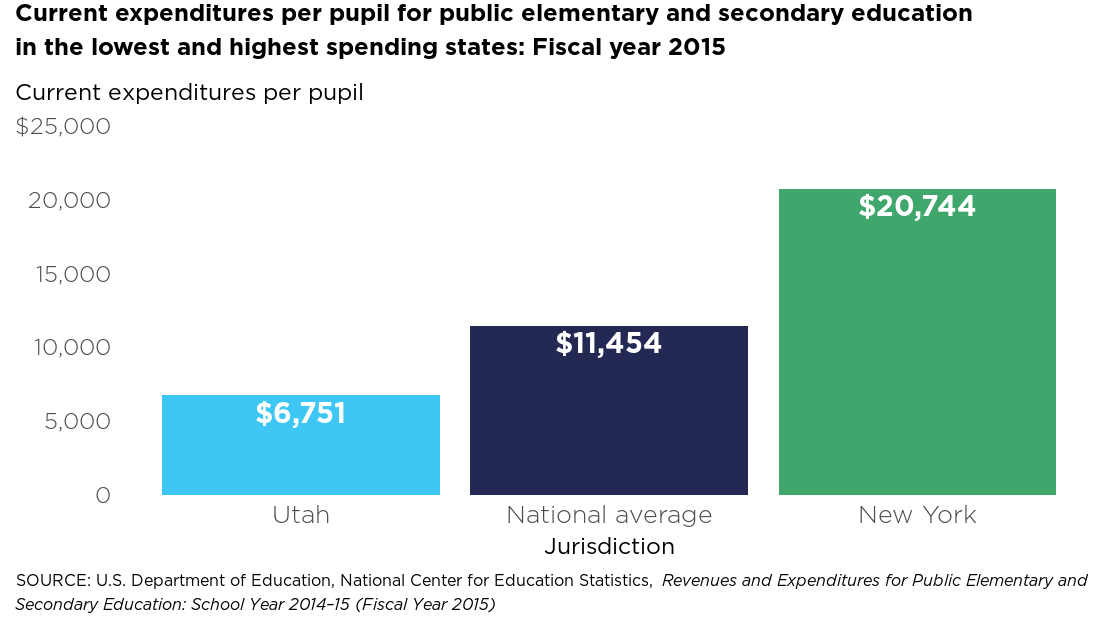
Highest and lowest spending states per public education pupil
Current expenditures per pupil ranged from $6,751 in Utah to $20,744 in New York for FY 2015
animation
dataviz
ggplot2
gganimate
R
NCES
line
2017
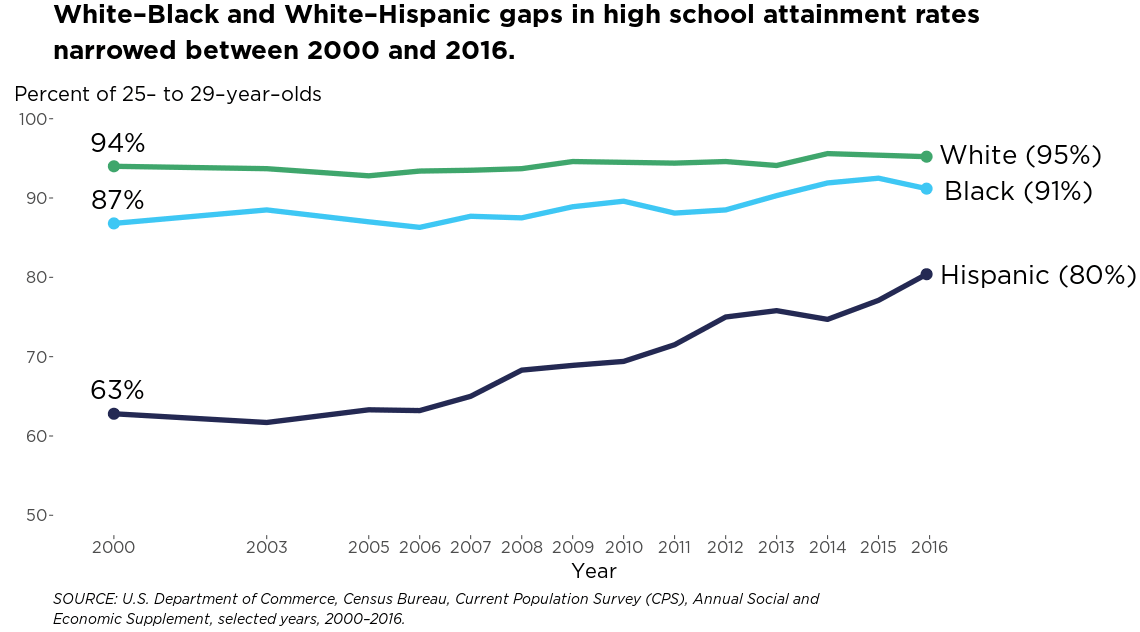
High School Attainment - Line Chart from COE 2017 Data Release
White-Black and White-Hispanic gaps in high school attainment rates\ arrowed between 2000 and 2016.
animation
dataviz
ggplot2
gganimate
R
NCES
line
2017
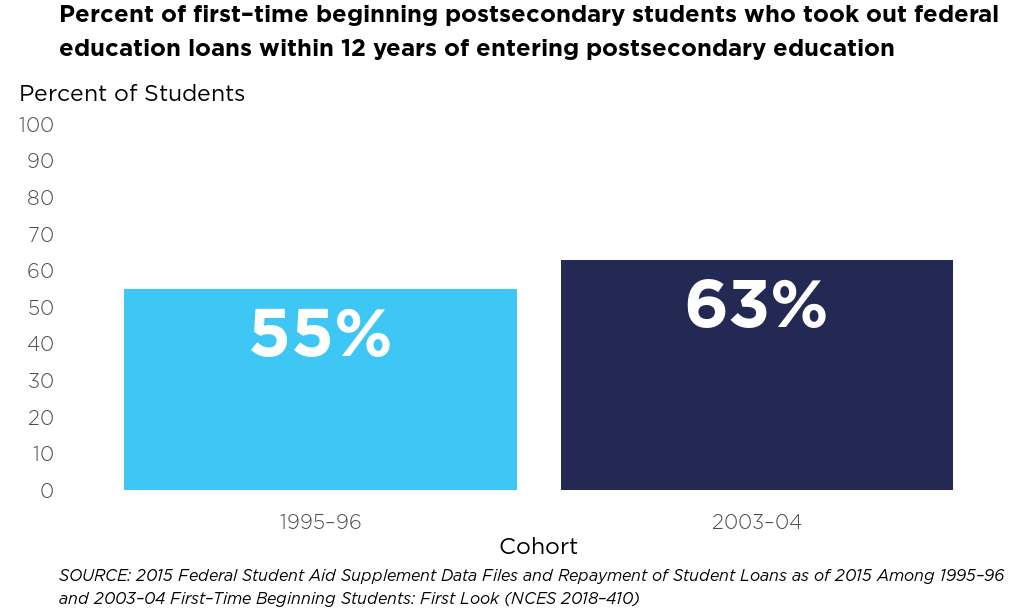
Percent of Borrowers by Cohort - Animated Bar Chart
The percent of first-time beginning postsecondary students who took out federal education loans within 12 years of entering postsecondary education increased from 55 to 63% over the last eight years.
animation
dataviz
ggplot2
R
NCES
bar
2017
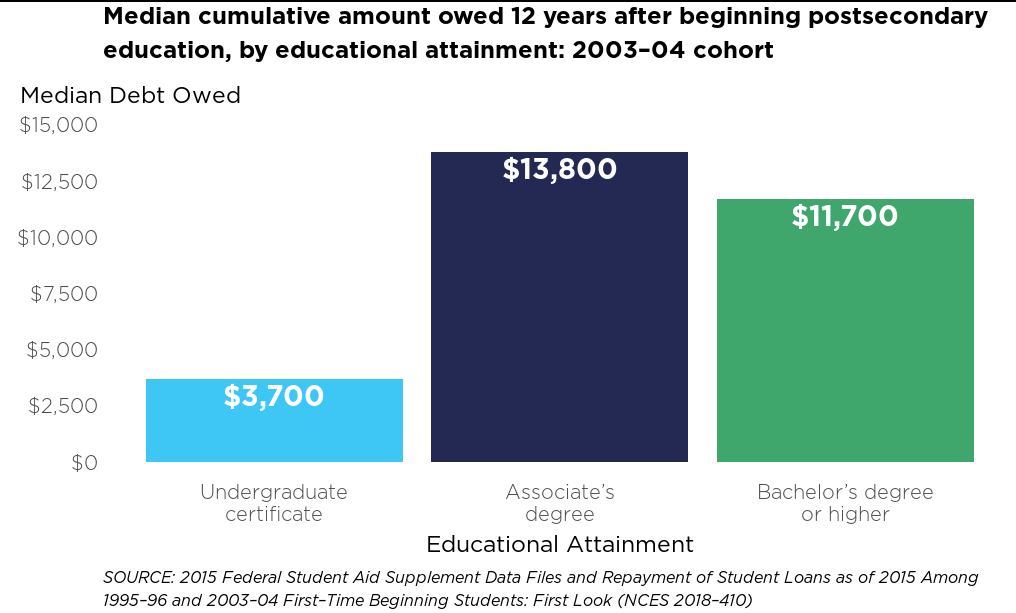
Median Debt By Educational Attainment - Animated Bar Chart
The median cumulative amount owed 12 years after beginning postsecondary education, by educational attainment: 2003-04 cohort
animation
dataviz
ggplot2
R
NCES
bar
2017
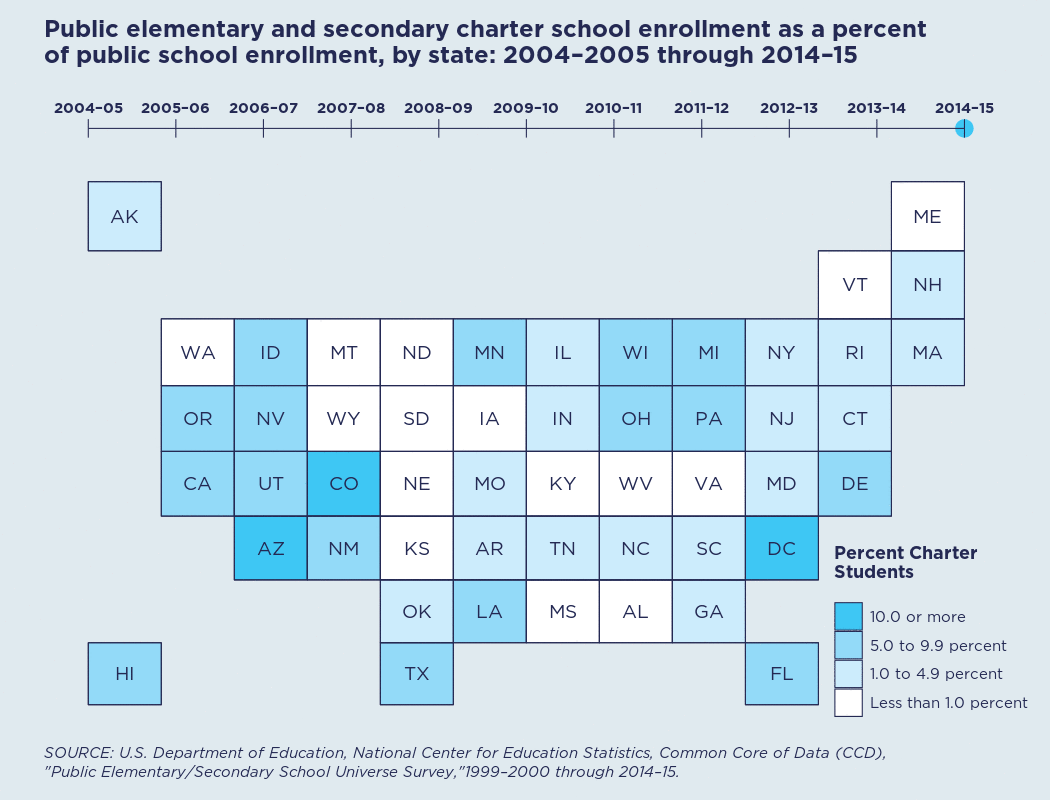
Charter School Enrollment, 2005 to 2015 - Animated State Grid Map
Change in public elementary and secondary charter school enrollment as a percent of public school enrollment, by state: 2004-2005 through 2014-2015
animation
dataviz
ggplot2
R
NCES
gridmap
2017
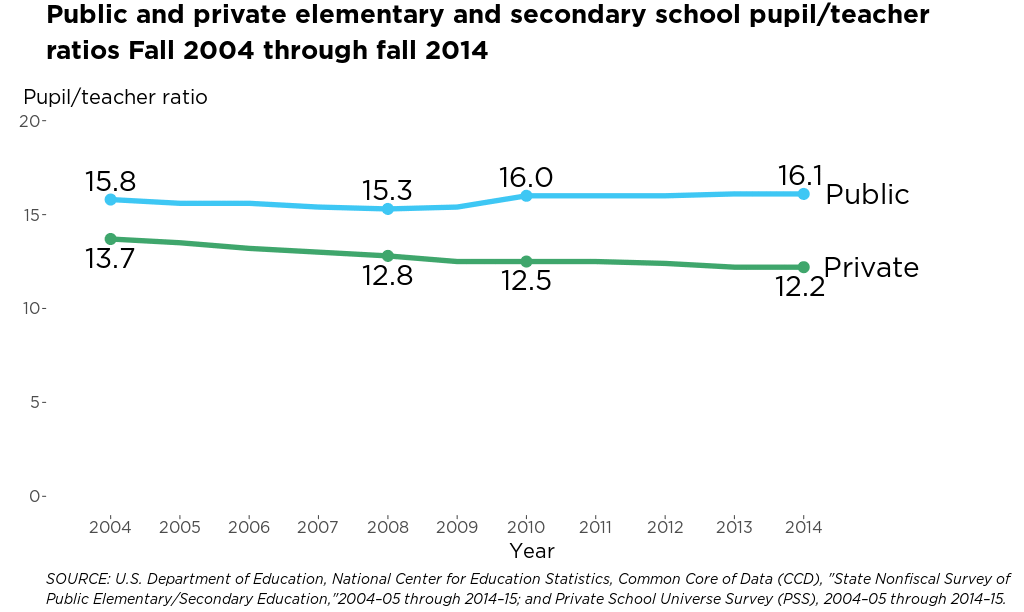
Teacher-Pupil Ratio: Line Chart from COE 2017 Data Release
Public and private elementary and secondary school pupil/teacher ratios Fall 2004 through 2014
animation
dataviz
ggplot2
gganimate
R
NCES
line
2017
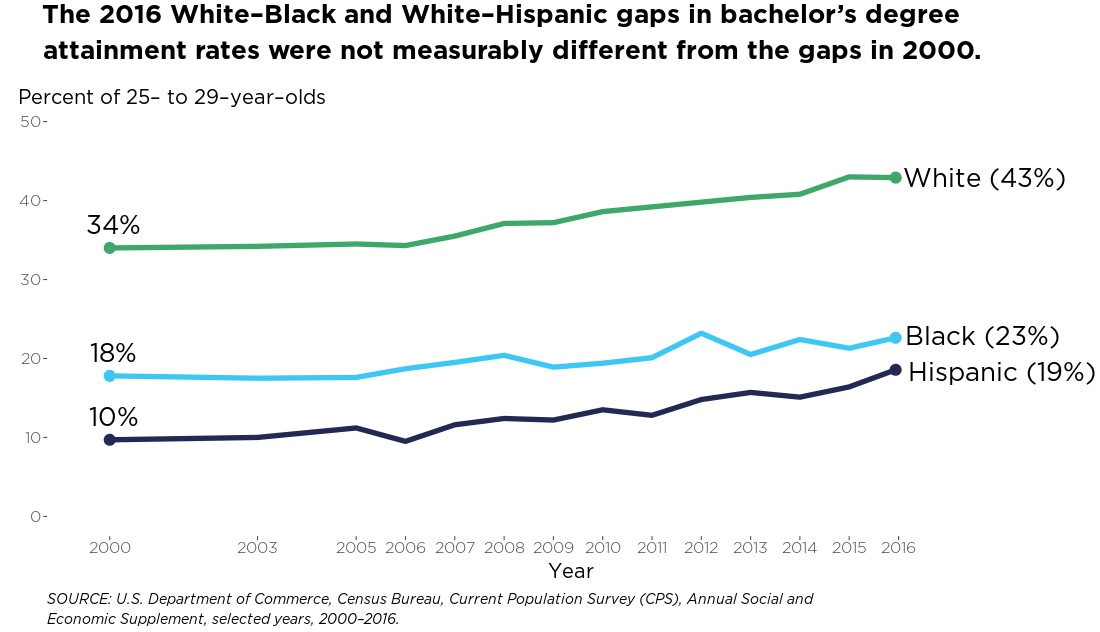
Educational Attainment - Line Chart from COE 2017 Data Release
The 2016 White-Black and White-Hispanic gaps in bachelor’s degree attainment rates were not measurably different from the gaps in 2000
animation
dataviz
ggplot2
gganimate
R
NCES
line